A few days ago, we were reading the latest Nvidia RTX 50 series GPU rumors, and something didn’t sound quite right to us. It wasn’t the information itself – we’ve got no idea whether it’s true or not – it was the supposed configuration that Nvidia is going with for the “RTX 5080.”
The rumored specifications for that model, relative to the leaked specs for the RTX 5090, just didn’t stack up based on what we’ve usually come to expect from an “80-class” GPU. And if Nvidia does indeed cut down the RTX 5080 to such a huge degree as these rumors are suggesting, it will be the weakest 80-class card relative to the flagship model in Nvidia’s history.
What does an Nvidia GPU in a given class typically look like throughout history?
And this got us thinking: what does an Nvidia GPU in a given class typically look like throughout history? How does the average 80-tier model, 70-tier model, 60-tier model usually come configured relative to the flagship model?
Because if we’re armed with this information ahead of any next-gen GPU launches, we can ground our expectations in reality and push back if necessary against a product that is offering consumers less than they’ve historically gotten.
We can also use this data to assess any GeForce RTX 50-series rumors to see how supposed configurations would compare to more than a decade of releases.
10 Years of Nvidia GPU Configurations
The first part of this analysis will be determining which model actually fits into each class, because each generation has seen a different lineup.
We’ve ended up going with this labeling scheme:
- Extreme Flagship
- Flagship
- x80 Ti Class
- x80 Class
- x70 Class
- x60 Class
The 60, 70, 80, and 80 Ti class models are pretty straightforward, then the flagship and extreme flagship cards at the very top. Granted, determining the actual flagship model is difficult as some models have come out much later than others; some models were so ridiculously priced that no one would have considered them the “sensible” flagship in that generation, so we ended up designating the flagship card as the GPU most people considered the best of that generation.
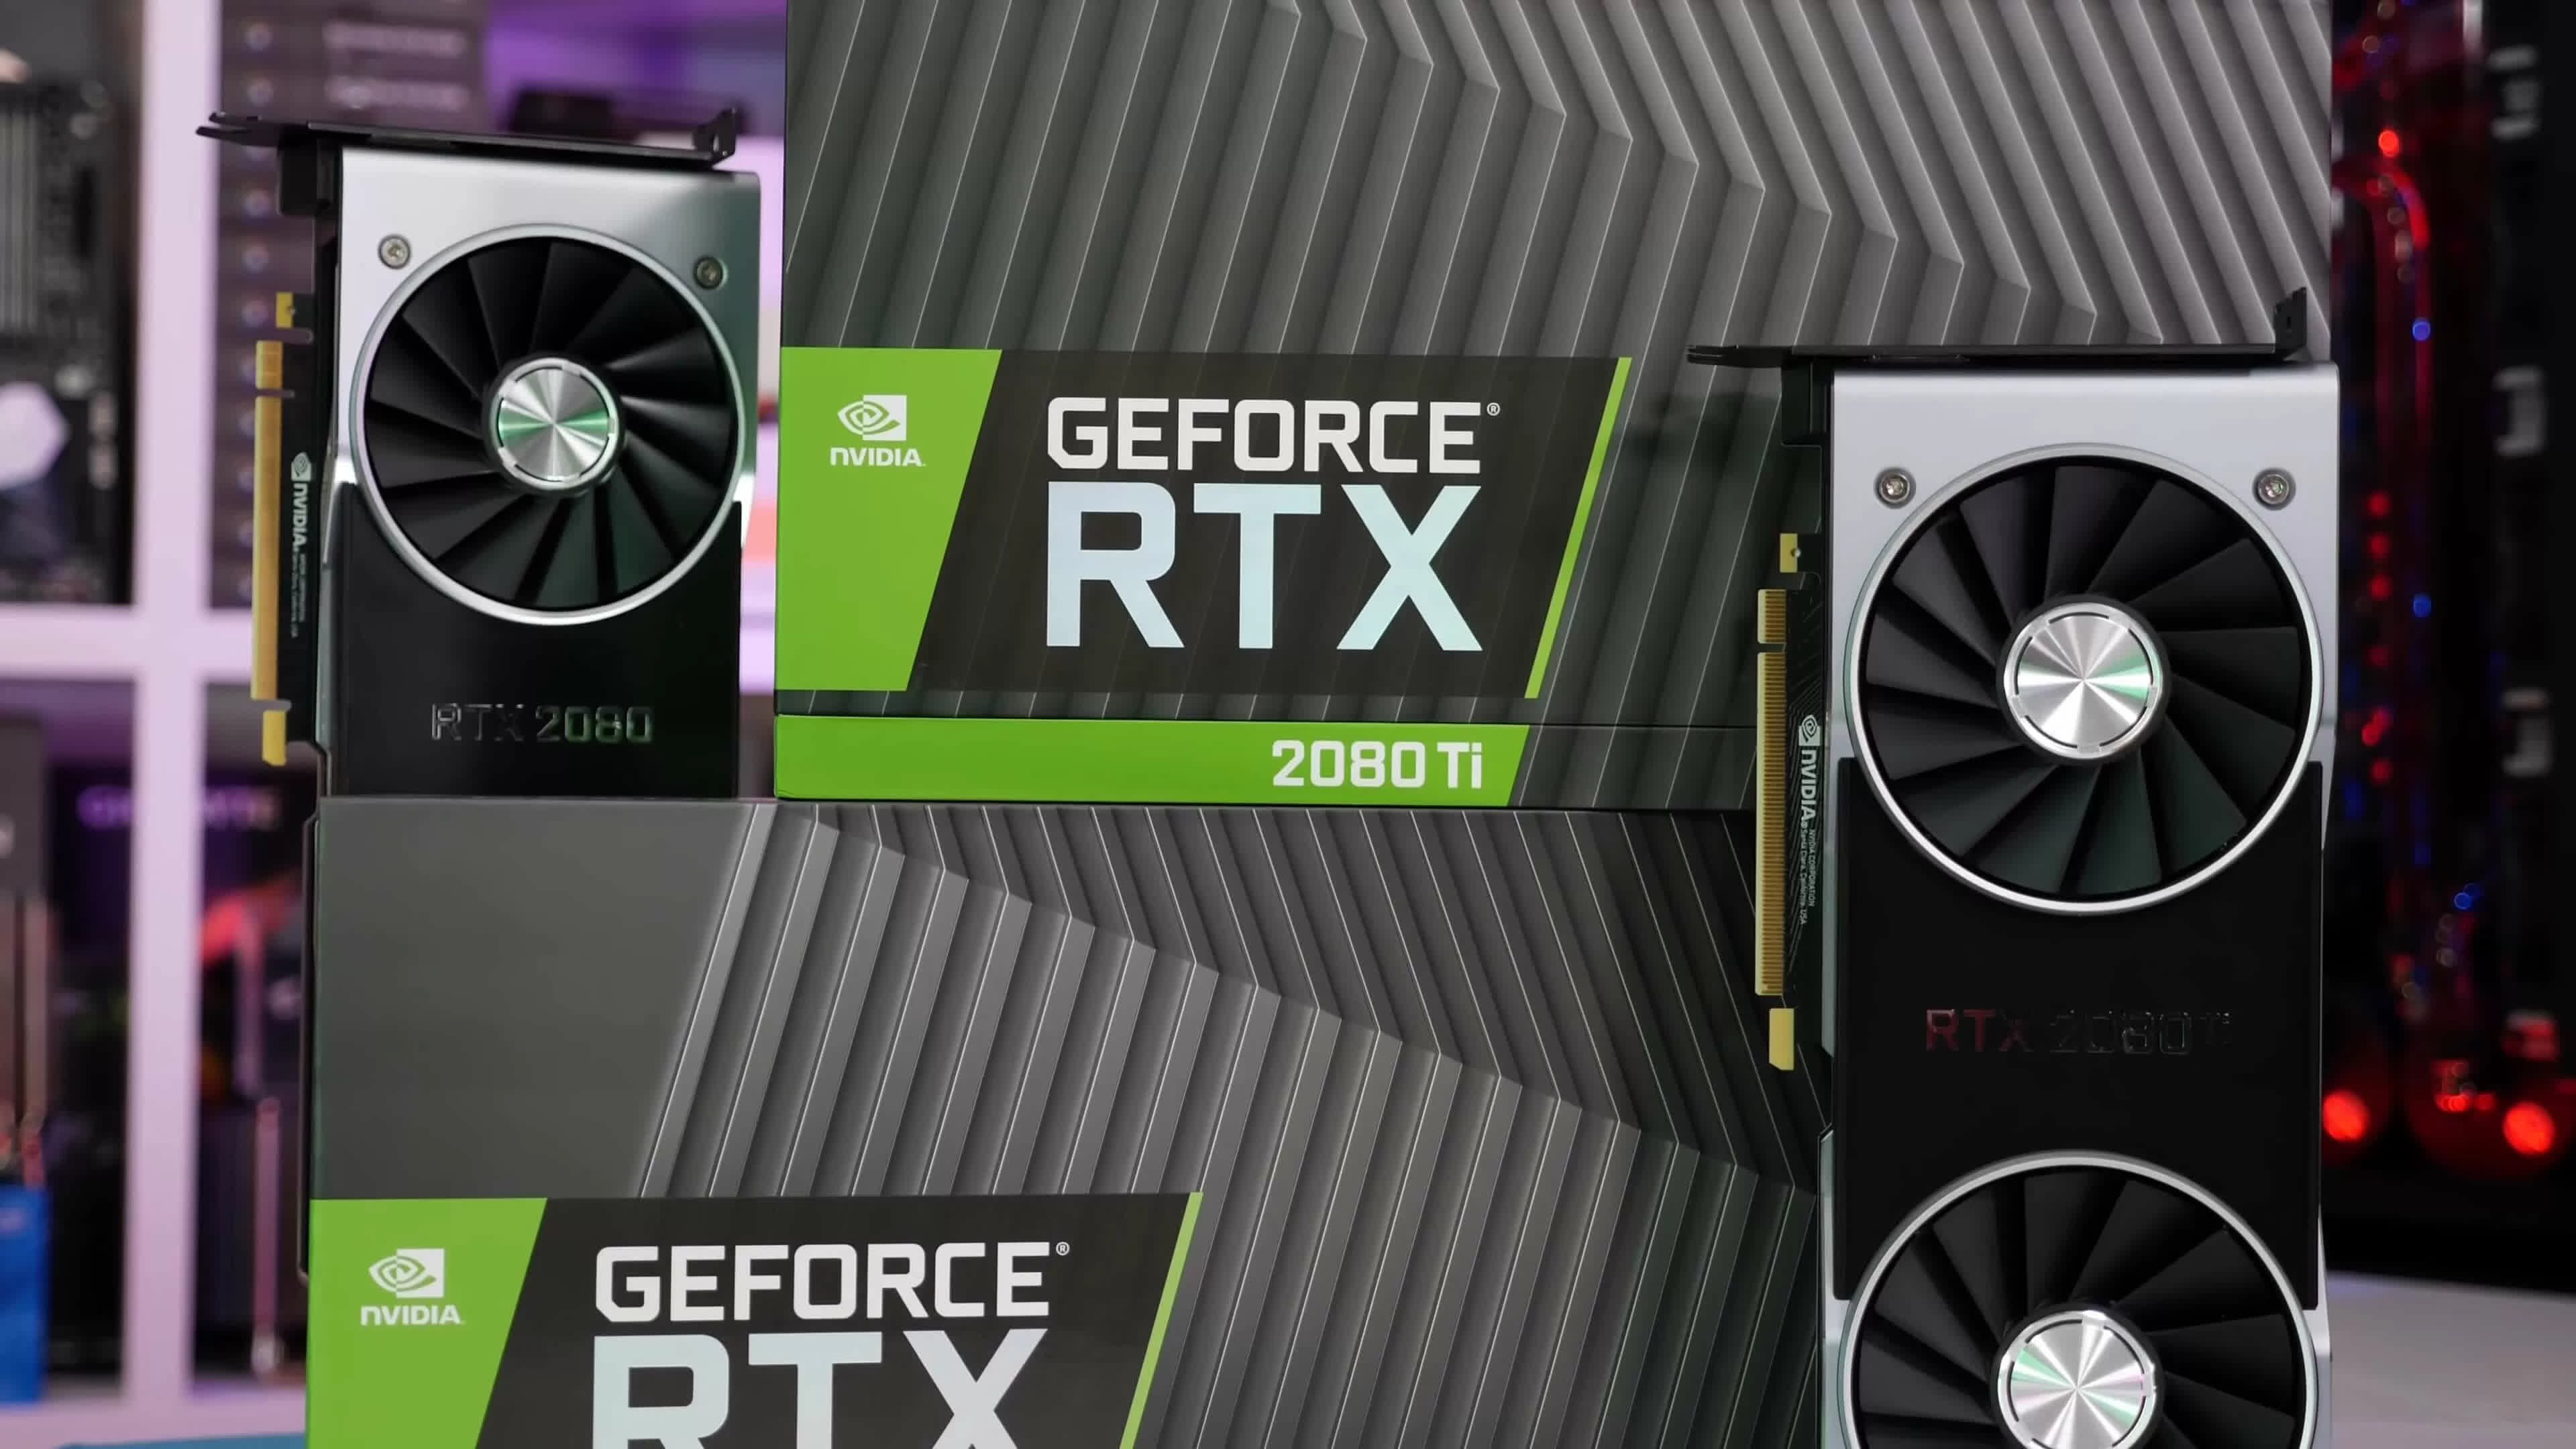
For example, in the GeForce RTX 20 series, the flagship card was generally considered to be the RTX 2080 Ti at $1,200, but if you really wanted to go crazy you could have purchased the Titan RTX as an extreme flagship model.
Similarly, in the GeForce RTX 30 series we had the regular flagship as the RTX 3090, and the extreme flagship came later – the $2,000 RTX 3090 Ti – if you just had to have the best. For the purposes of this article, we’ve also excluded the dual-GPU GTX Titan Z that was available in the 700 series, so we can analyze single-GPU models only.
Nvidia GPUs: Generations
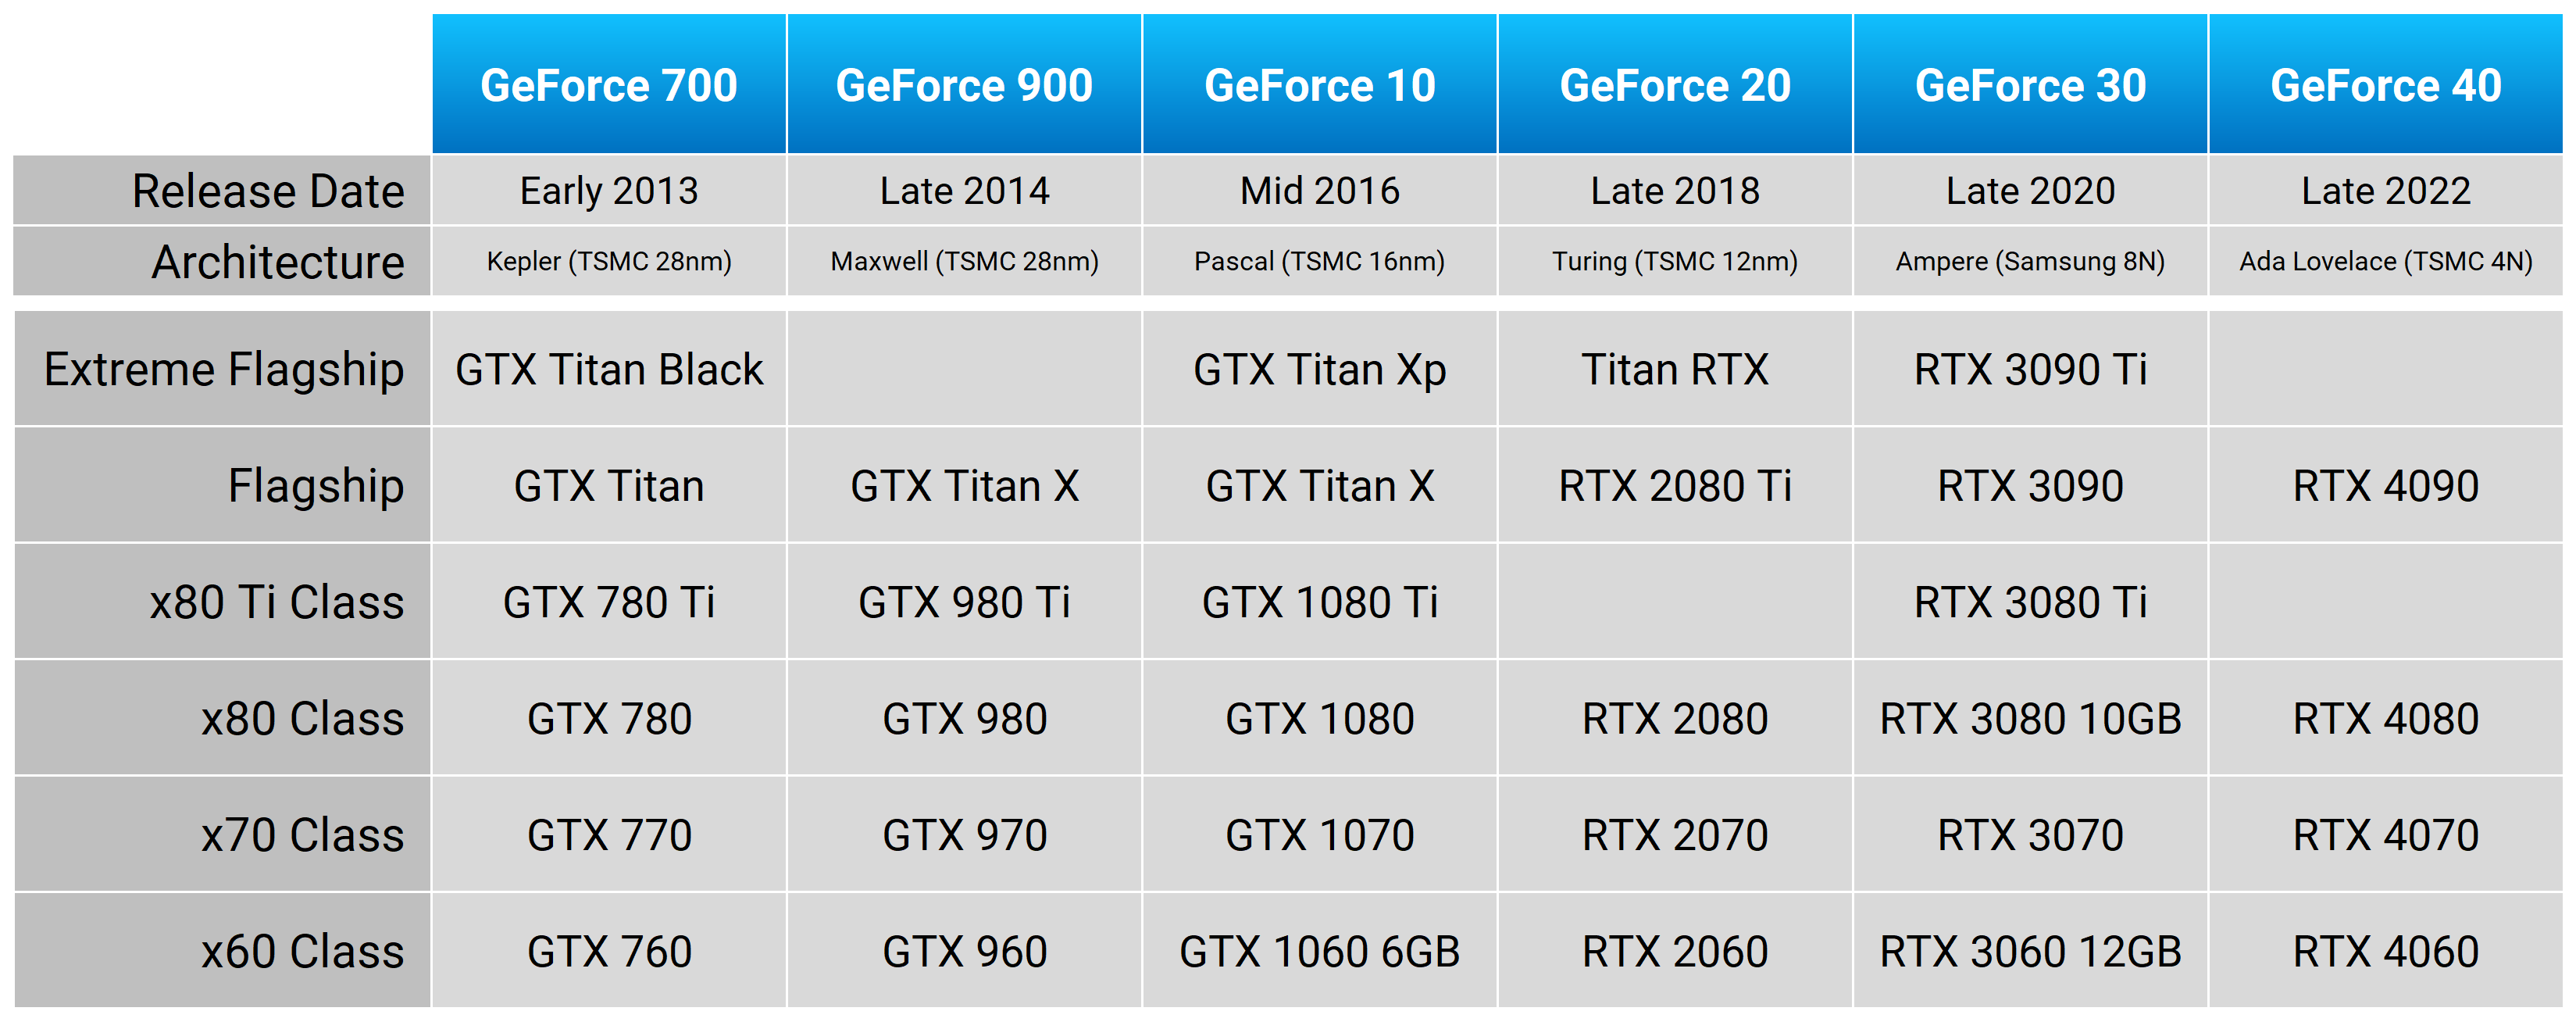
We’ve gone back as far as the GeForce 700 series here, which was first released more than 11 years ago in 2013, because this is the first generation in which Nvidia produced single-GPU models above the 80-class. This is the start of what we’d describe as the “current” lineup structure. Prior to that, the top model tended to be the 80-class GPU, with the occasional dual-GPU model thrown in.
Core Count Configurations
One of the most important aspects of a GPU that varies significantly between models is the shader core count. Nvidia’s flagship models tend to be either fully unlocked versions of their largest GPU die, or close to fully unlocked, depending on the generation. As we move down the product stack, new smaller dies are introduced, and existing dies are further cut down to reduce the shader core count.
Nvidia GPUs: Shader (CUDA) Core Count
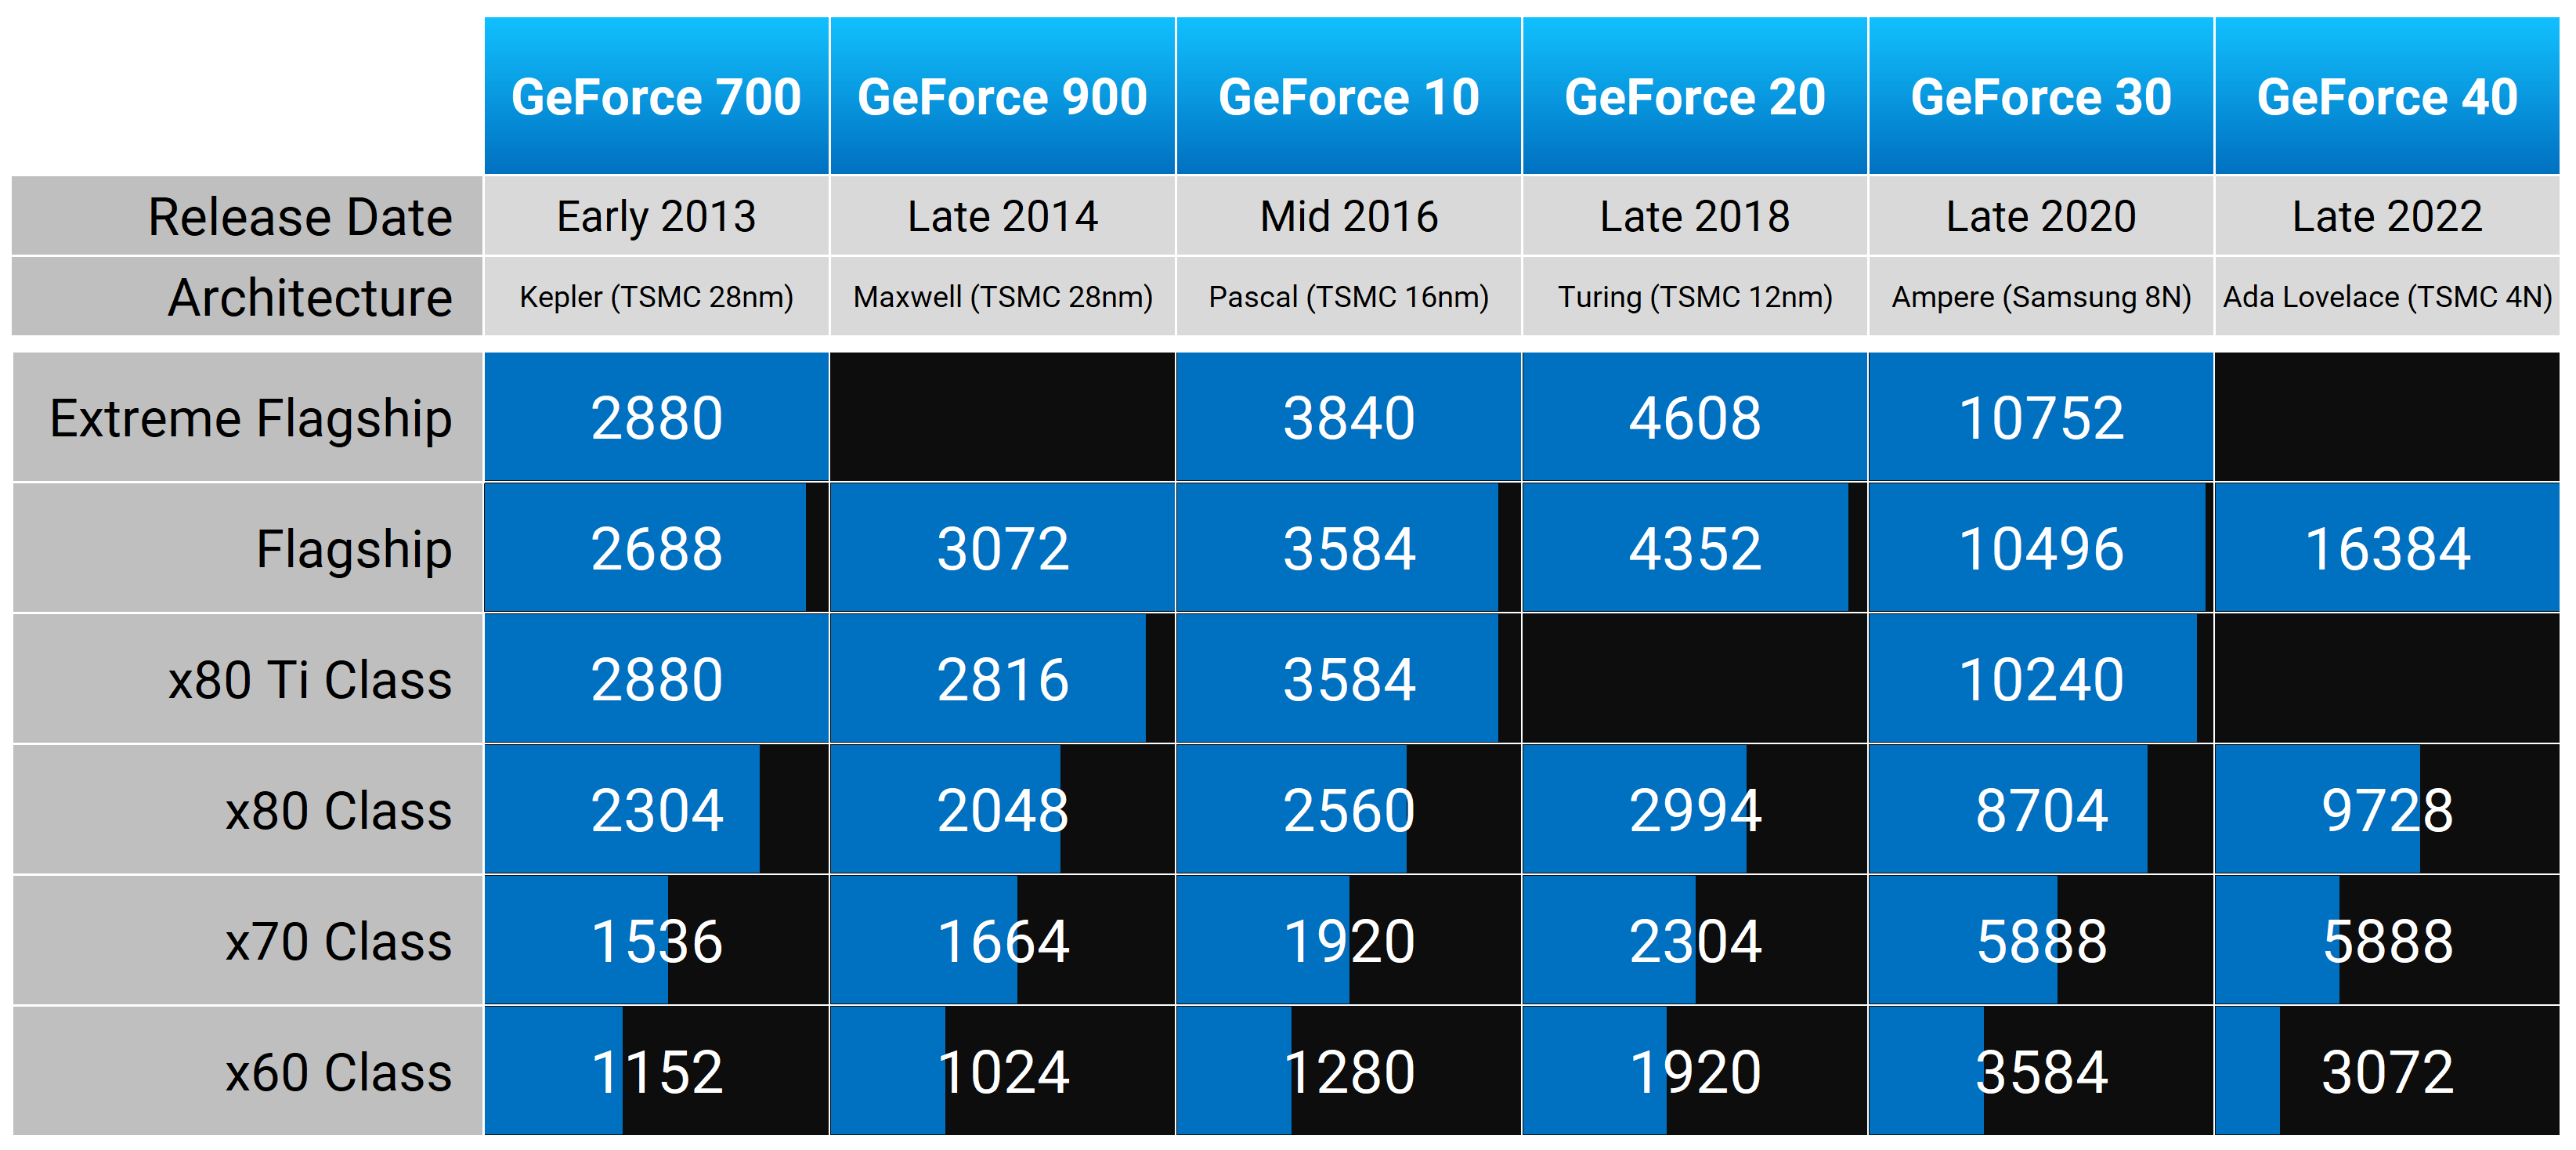
Generally, the 80-tier model has between 60 and 80 percent of the cores that the flagship model has. On the high end of the scale, the GTX 780 had 2,304 CUDA cores relative to 2,688 on the flagship GTX Titan, so the 80-tier model back in 2013 was cut down to 86% of the size.
On the lower end of the scale, we’ve had the GeForce 900 series, where the 2,048 CUDA core GTX 980 was just 67% the size of the GTX Titan X, and more recently the RTX 4080 with 9,728 CUDA cores was just 59% the size of the RTX 4090 with its 16,384 cores – ouch.
How much the 80 series has been cut down over the years has changed, but generally, as far as the core is concerned, it’s around a 30% reduction relative to the flagship.
Then for the 70-tier models, usually the GPU core is about half the size of the flagship, or slightly more than half. This is true for the GTX 770, GTX 970, GTX 1070, RTX 2070, and RTX 3070, but not the RTX 4070, which was cut down more than usual to just 5,888 CUDA cores, making it just 36% the size of the flagship 4090.
As we move down to the 60-tier, we find that GPU cores are typically about one third the size of the flagship, and again this holds true for the five generations prior to Ada Lovelace; unfortunately, that RTX 4060 just doesn’t reach the usual standard.
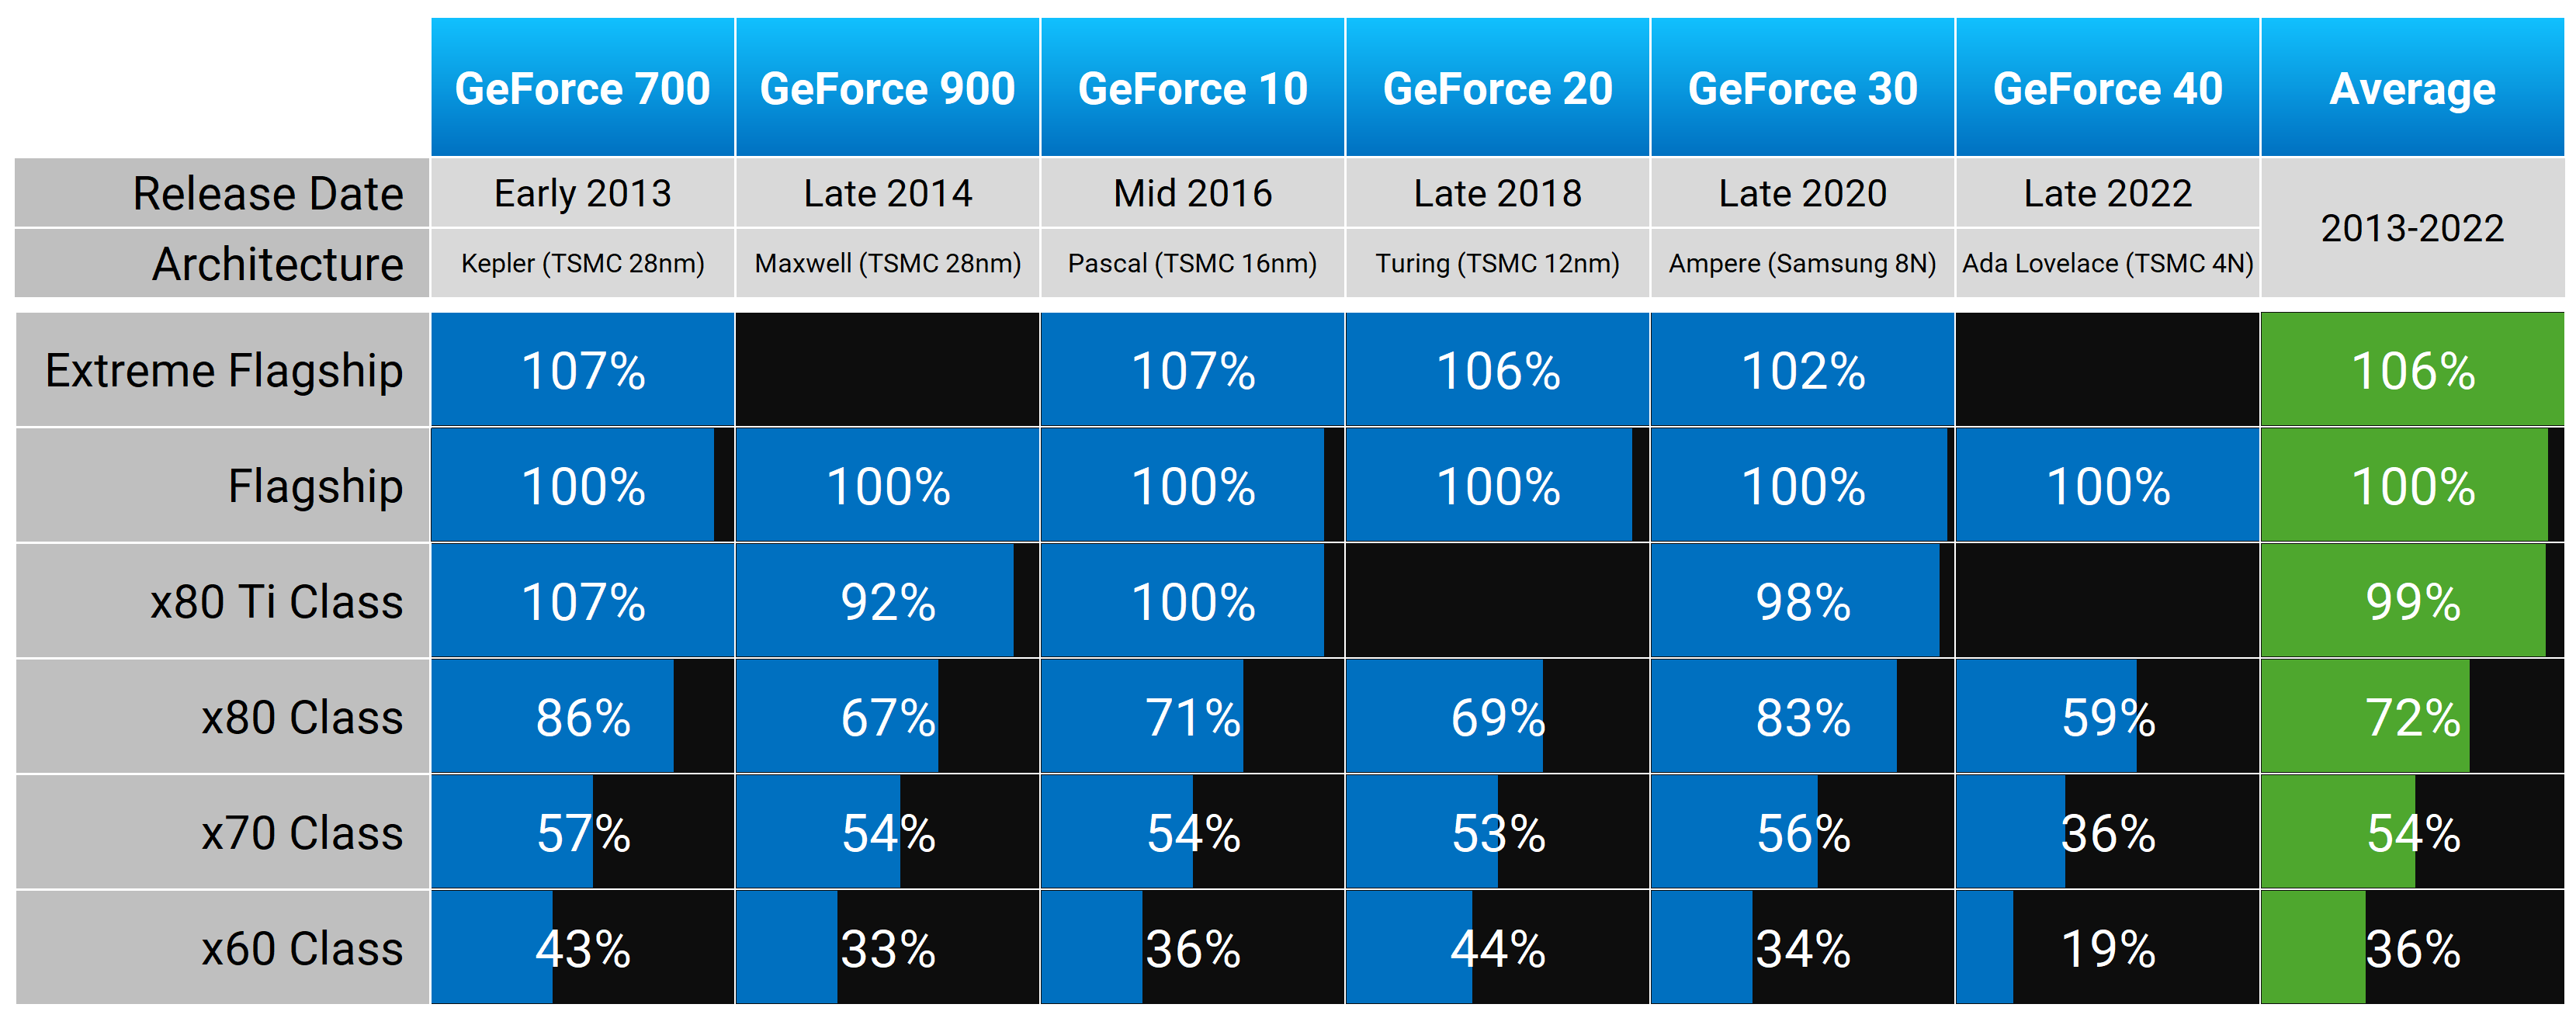
When we look at the size of each GPU’s shader core (in terms of core count) relative to the flagship model, we can create a nice six-generation average for each tier. On average, Nvidia’s 80 tier is 72% the size of the flagship model, the 70 tier is 54% the size, and the 60 tier is 36% the size.
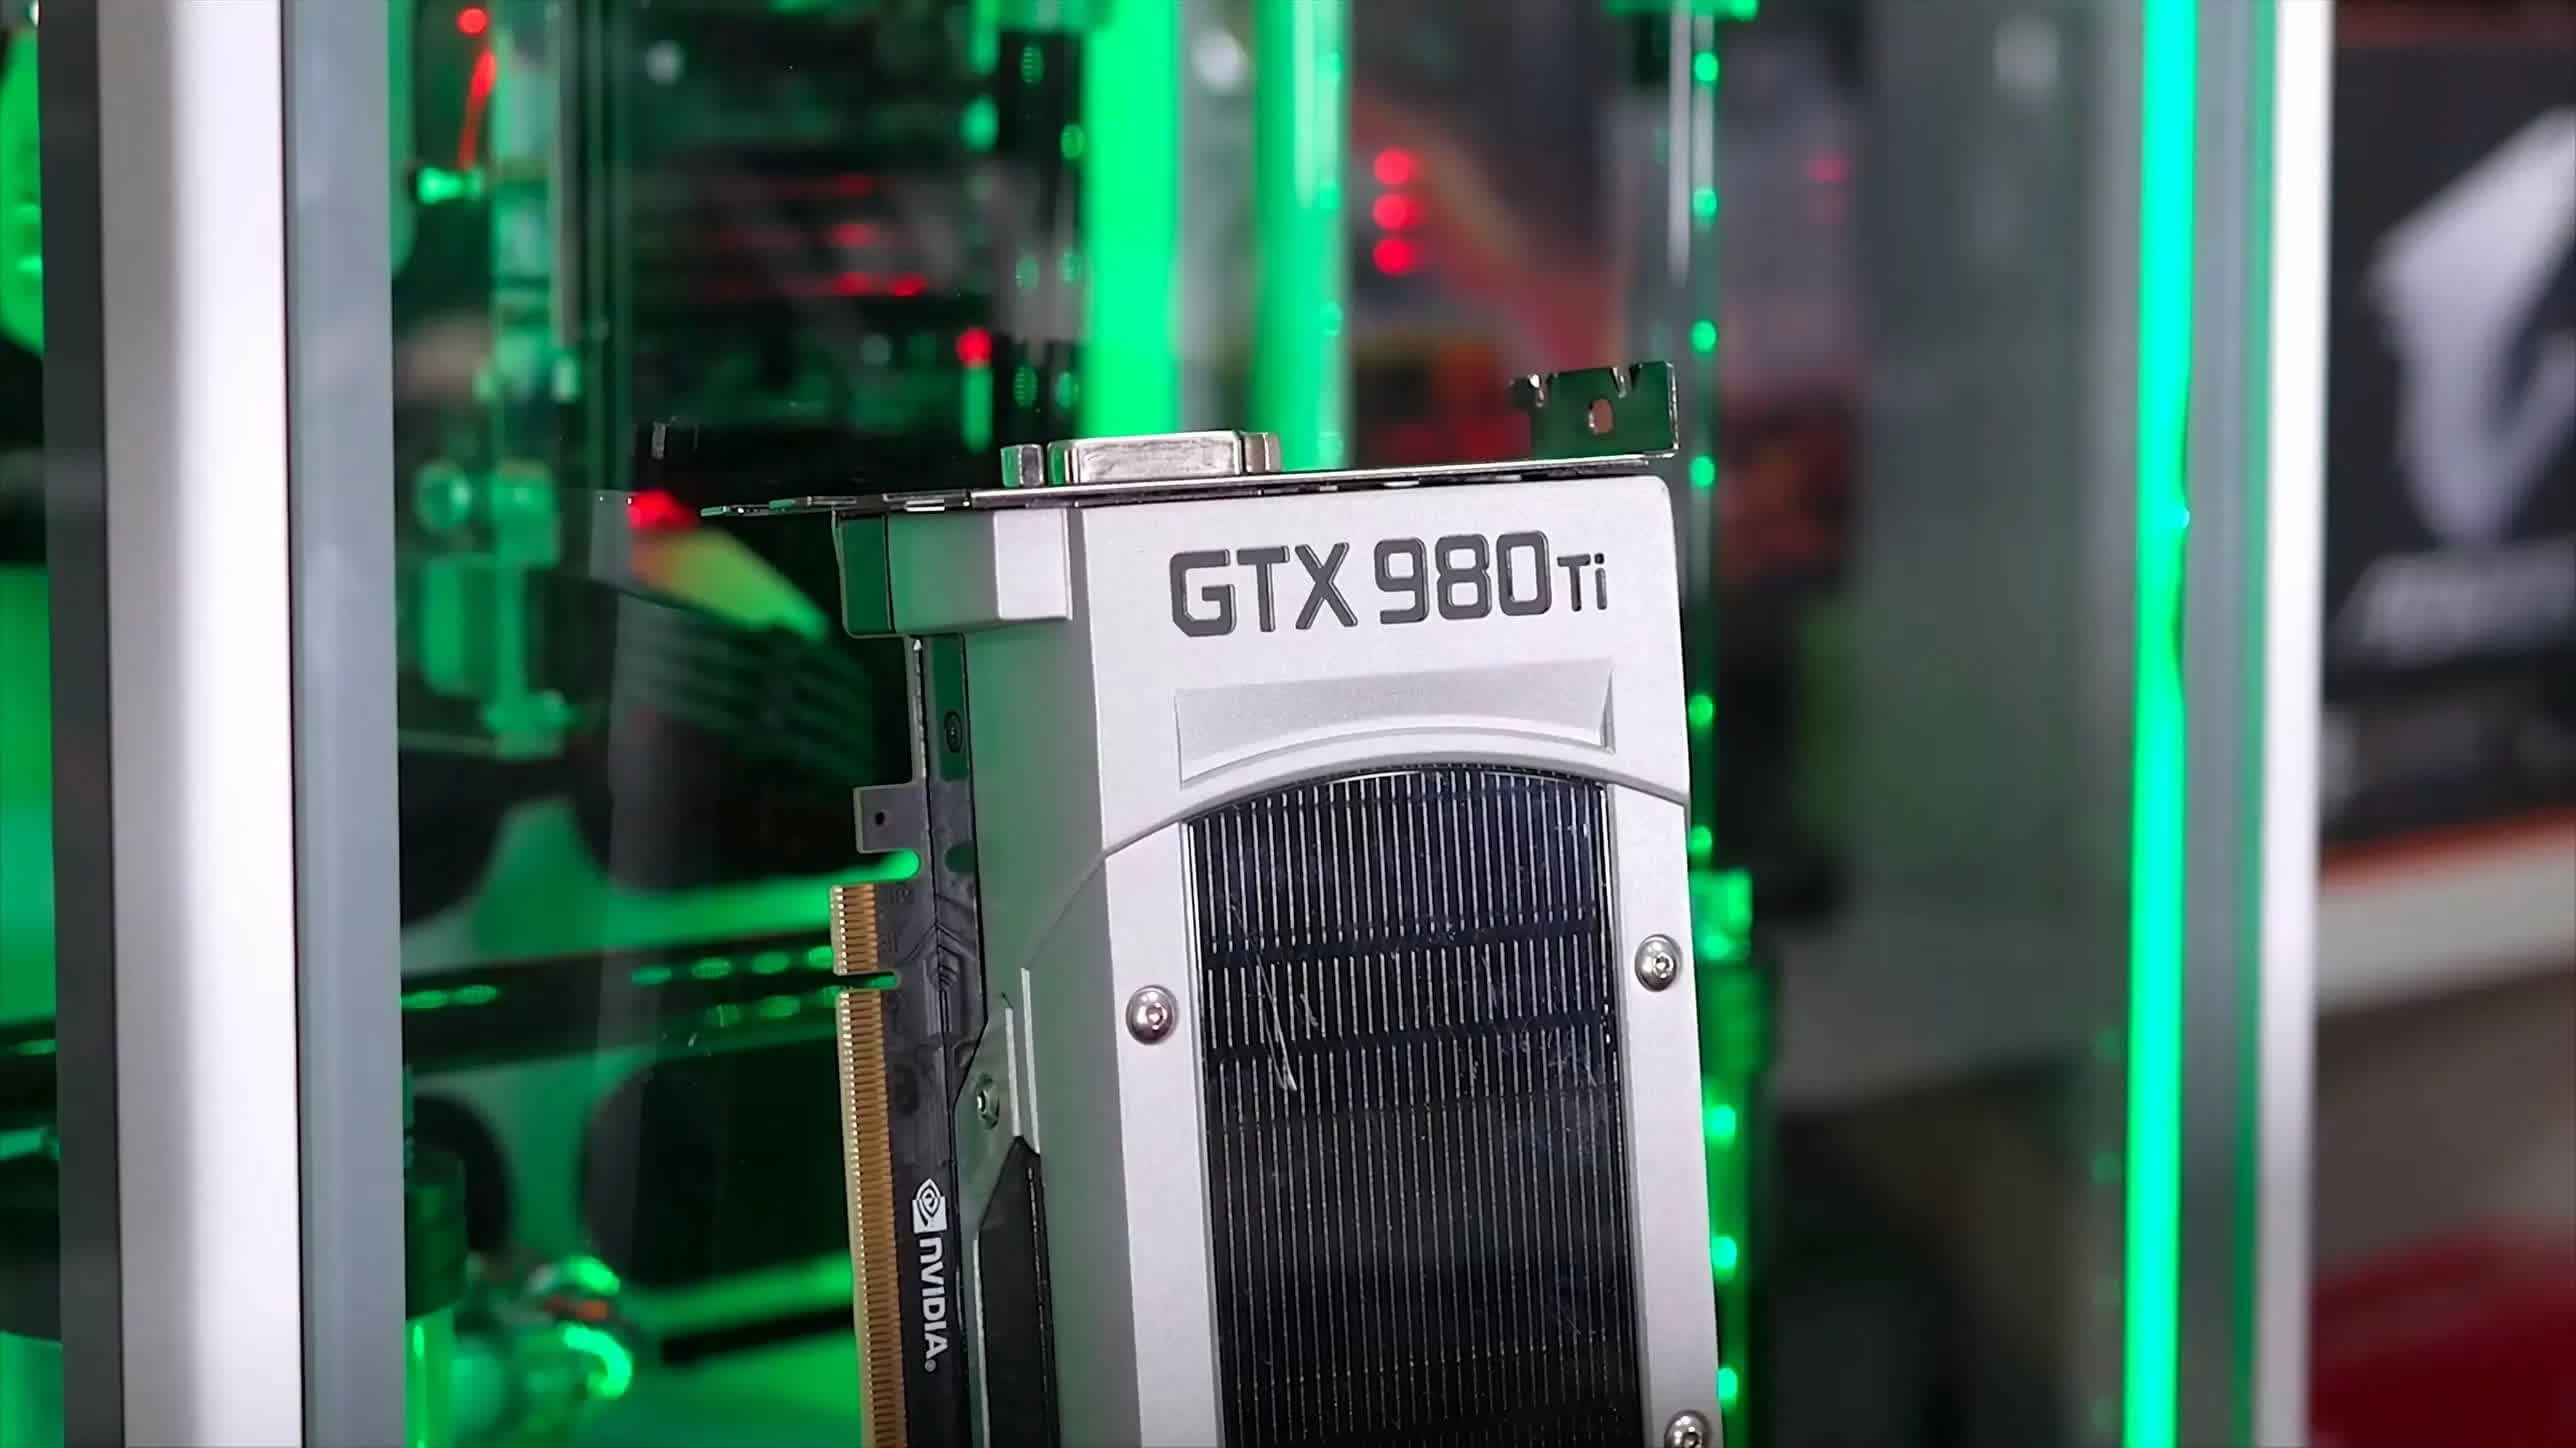
Historically, we can also see that the 80 Ti tier is very close in its core configuration to the flagship. For example, the RTX 3080 Ti with 10,240 CUDA cores was almost an RTX 3090 with 10,496 CUDA cores.
Over the years, this 80 Ti class has been Nvidia’s way to get almost the same level of performance as their best card, but in a better value model.
Memory Bandwidth Configurations
What also gets reduced between each tier is memory bandwidth. This is usually achieved through narrower memory buses on lower-tier cards, as well as lower clocked or worse spec memory. This can be combined into a GB/s metric that we can use to compare each generation in terms of overall memory bandwidth available to the GPU.
Nvidia GPUs: Memory Bandwidth (GB/s)
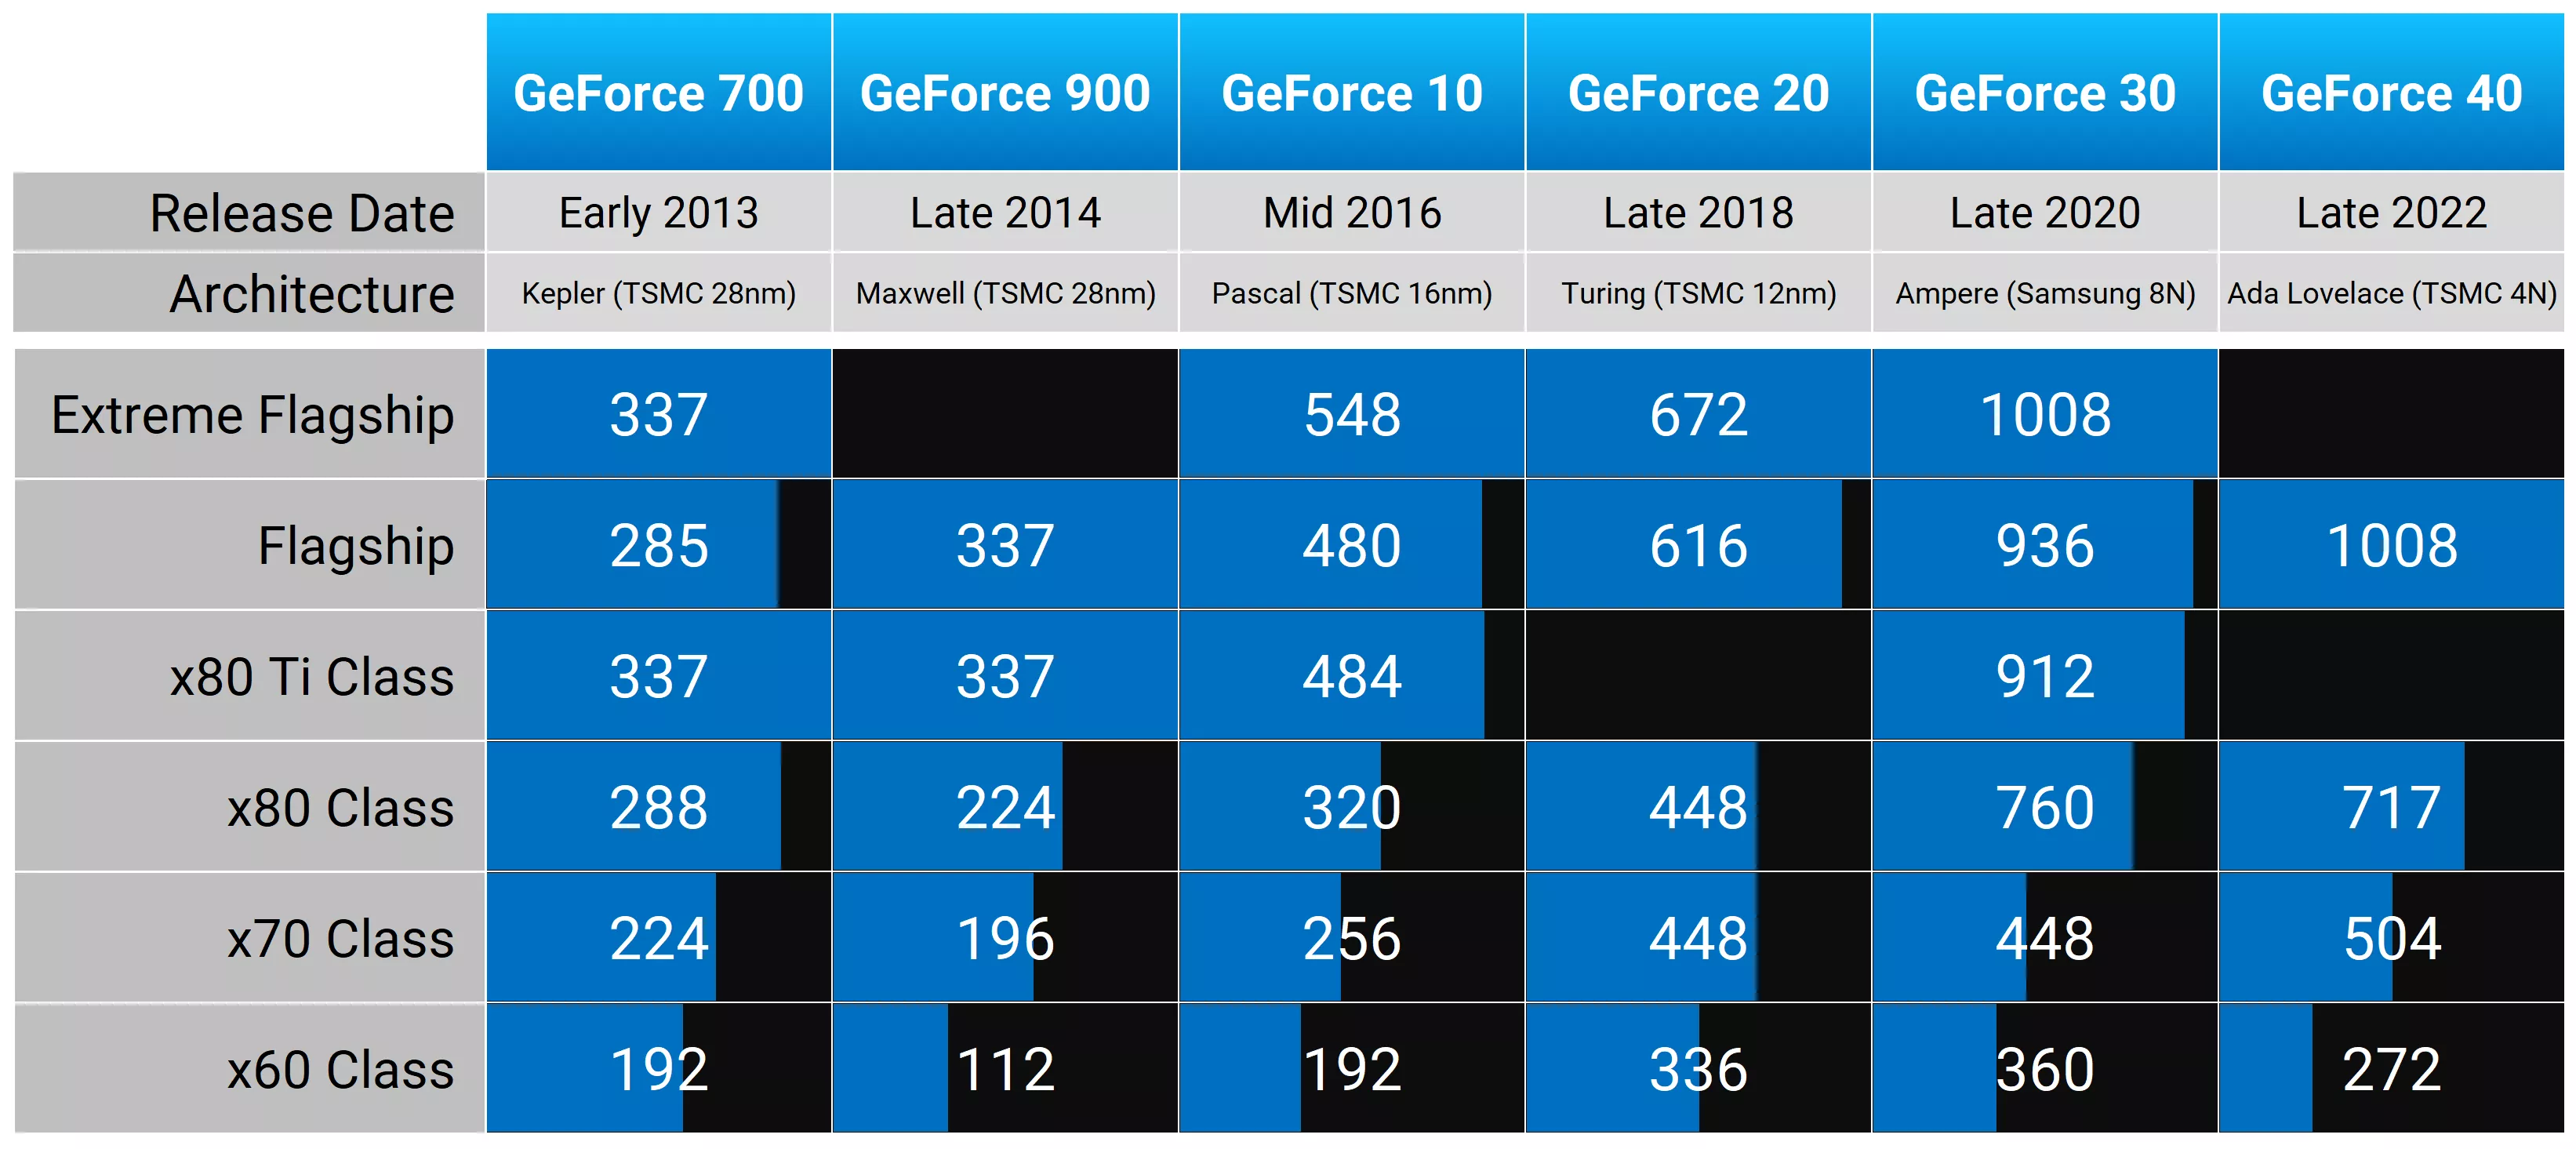
Memory bandwidth scaling between each tier has typically been pretty similar to the scaling seen in the shader core, though there are some exceptions.
For example, back in the GeForce 700 days, each tier punched above its weight in terms of bandwidth. The GTX Titan had 285 GB/s of bandwidth, but the GTX 760 retained 192 GB/s of bandwidth, just a 33% reduction.
The RTX 2070 and RTX 2080 both shared the same memory configuration, so while the core was cut back on the 70 tier card, it had a relatively over-spec level of memory bandwidth.
But generally speaking, what was seen in the GeForce 10 series days is pretty typical. The Titan X and 1080 Ti had around 480 GB/s of bandwidth, cut to 320 GB/s on the GTX 1080, cut to 256 GB/s on the GTX 1070, and then cut to 192 GB/s on the GTX 1060 6GB.
This was mostly achieved through cutting the memory bus with each tier, combined with dropping from GDDR5X memory on the higher cards to GDDR5 on the lower cards.
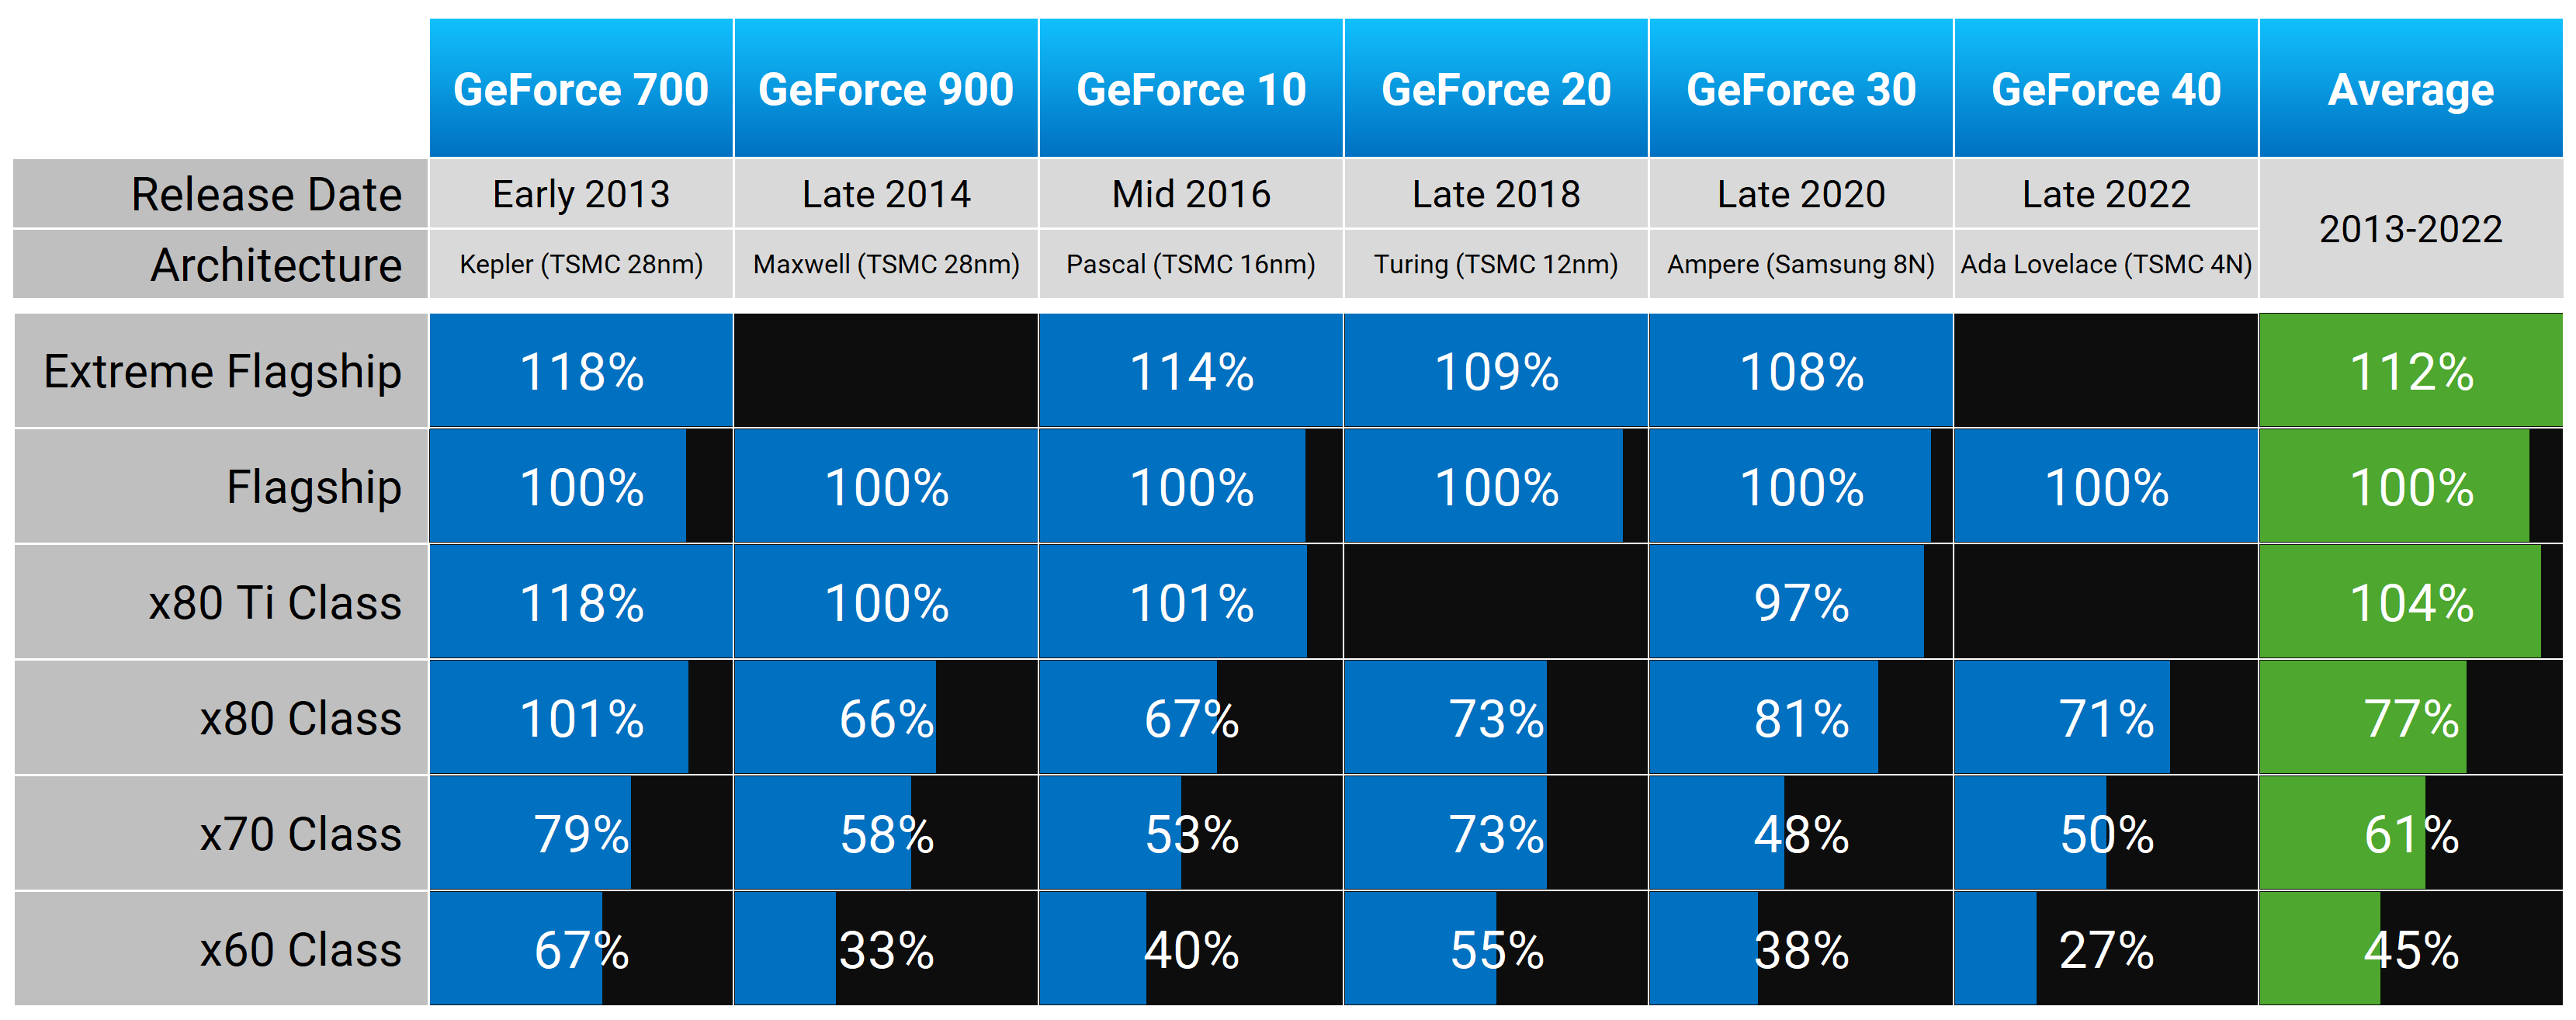
When looking at percentages relative to the flagship model, we can again create an average for what each tier typically looks like in terms of memory bandwidth. On average, the 80 tier gets 77% the memory bandwidth of the flagship card, the 70 tier gets 61% the bandwidth, and the 60 tier gets 45% the bandwidth. So memory bandwidth isn’t cut back as much as the core on average, but it’s a similar cadence where the 70 and 60 tier models end up with a little over and a little under half the memory bandwidth of the flagship card. We even typically see a slight bump to memory bandwidth for the 80 Ti class model.
VRAM Capacity Configurations
Then there’s VRAM capacity. This is one of the areas where Nvidia has historically given buyers of flagship models more, especially in generations like the 900 series, where the GTX Titan X had 12GB versus 6GB on the GTX 980 Ti, and more recently with 24GB on the RTX 3090 versus 12GB on the RTX 3080 Ti.
So while those 80 Ti models tend to not be cut back all that much in core configuration or memory bandwidth, getting half the VRAM is common and this is factored into the price.
Nvidia GPUs: VRAM Capacity (GB)
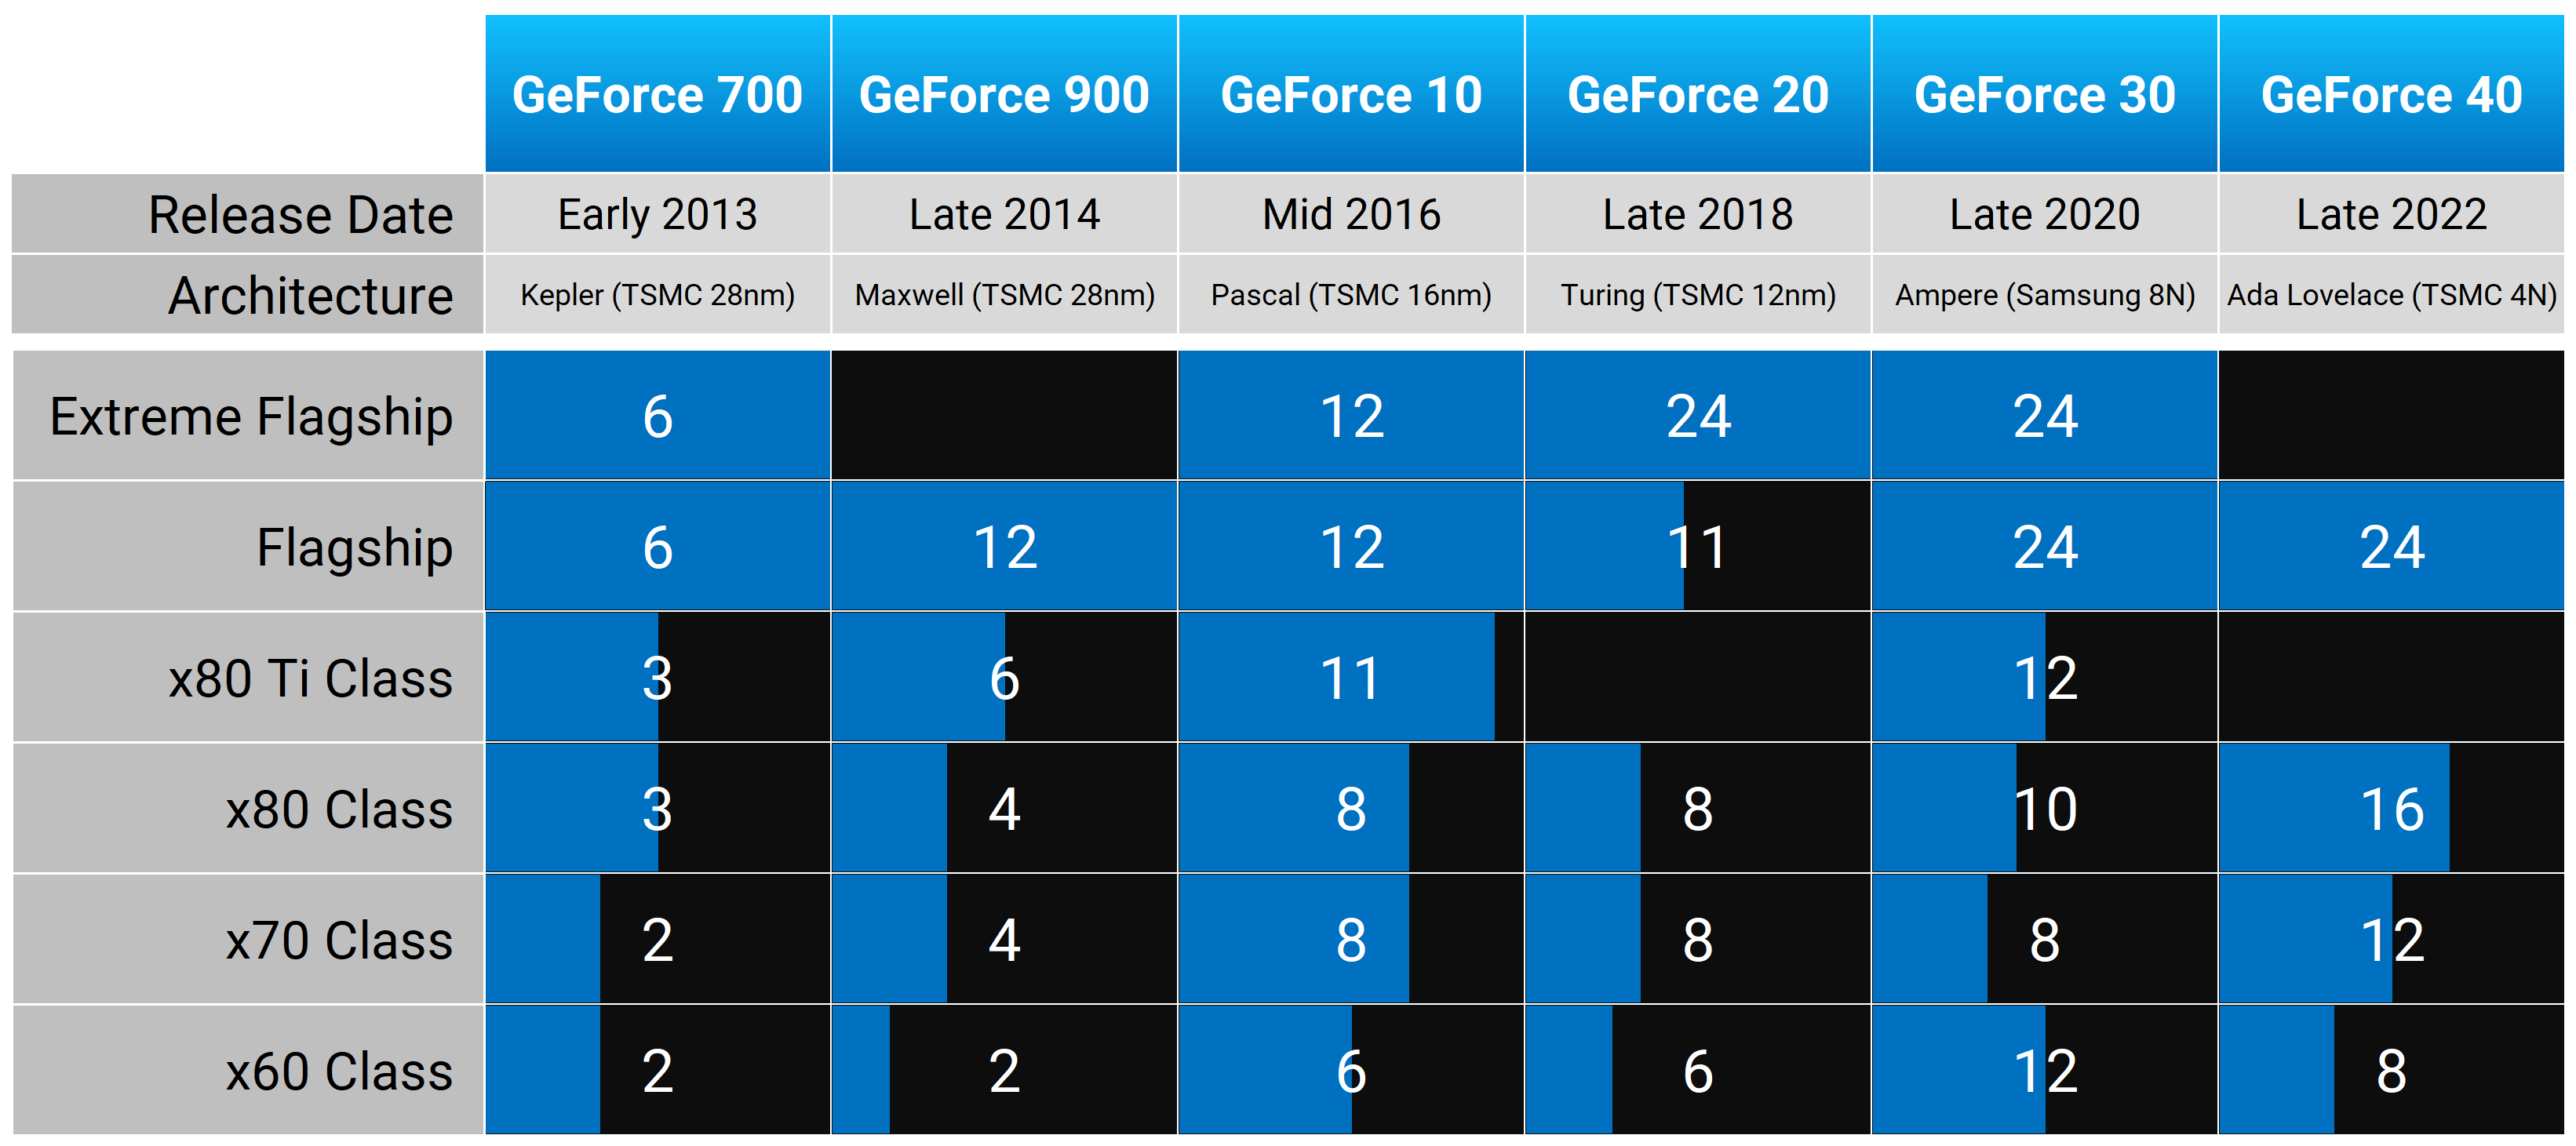
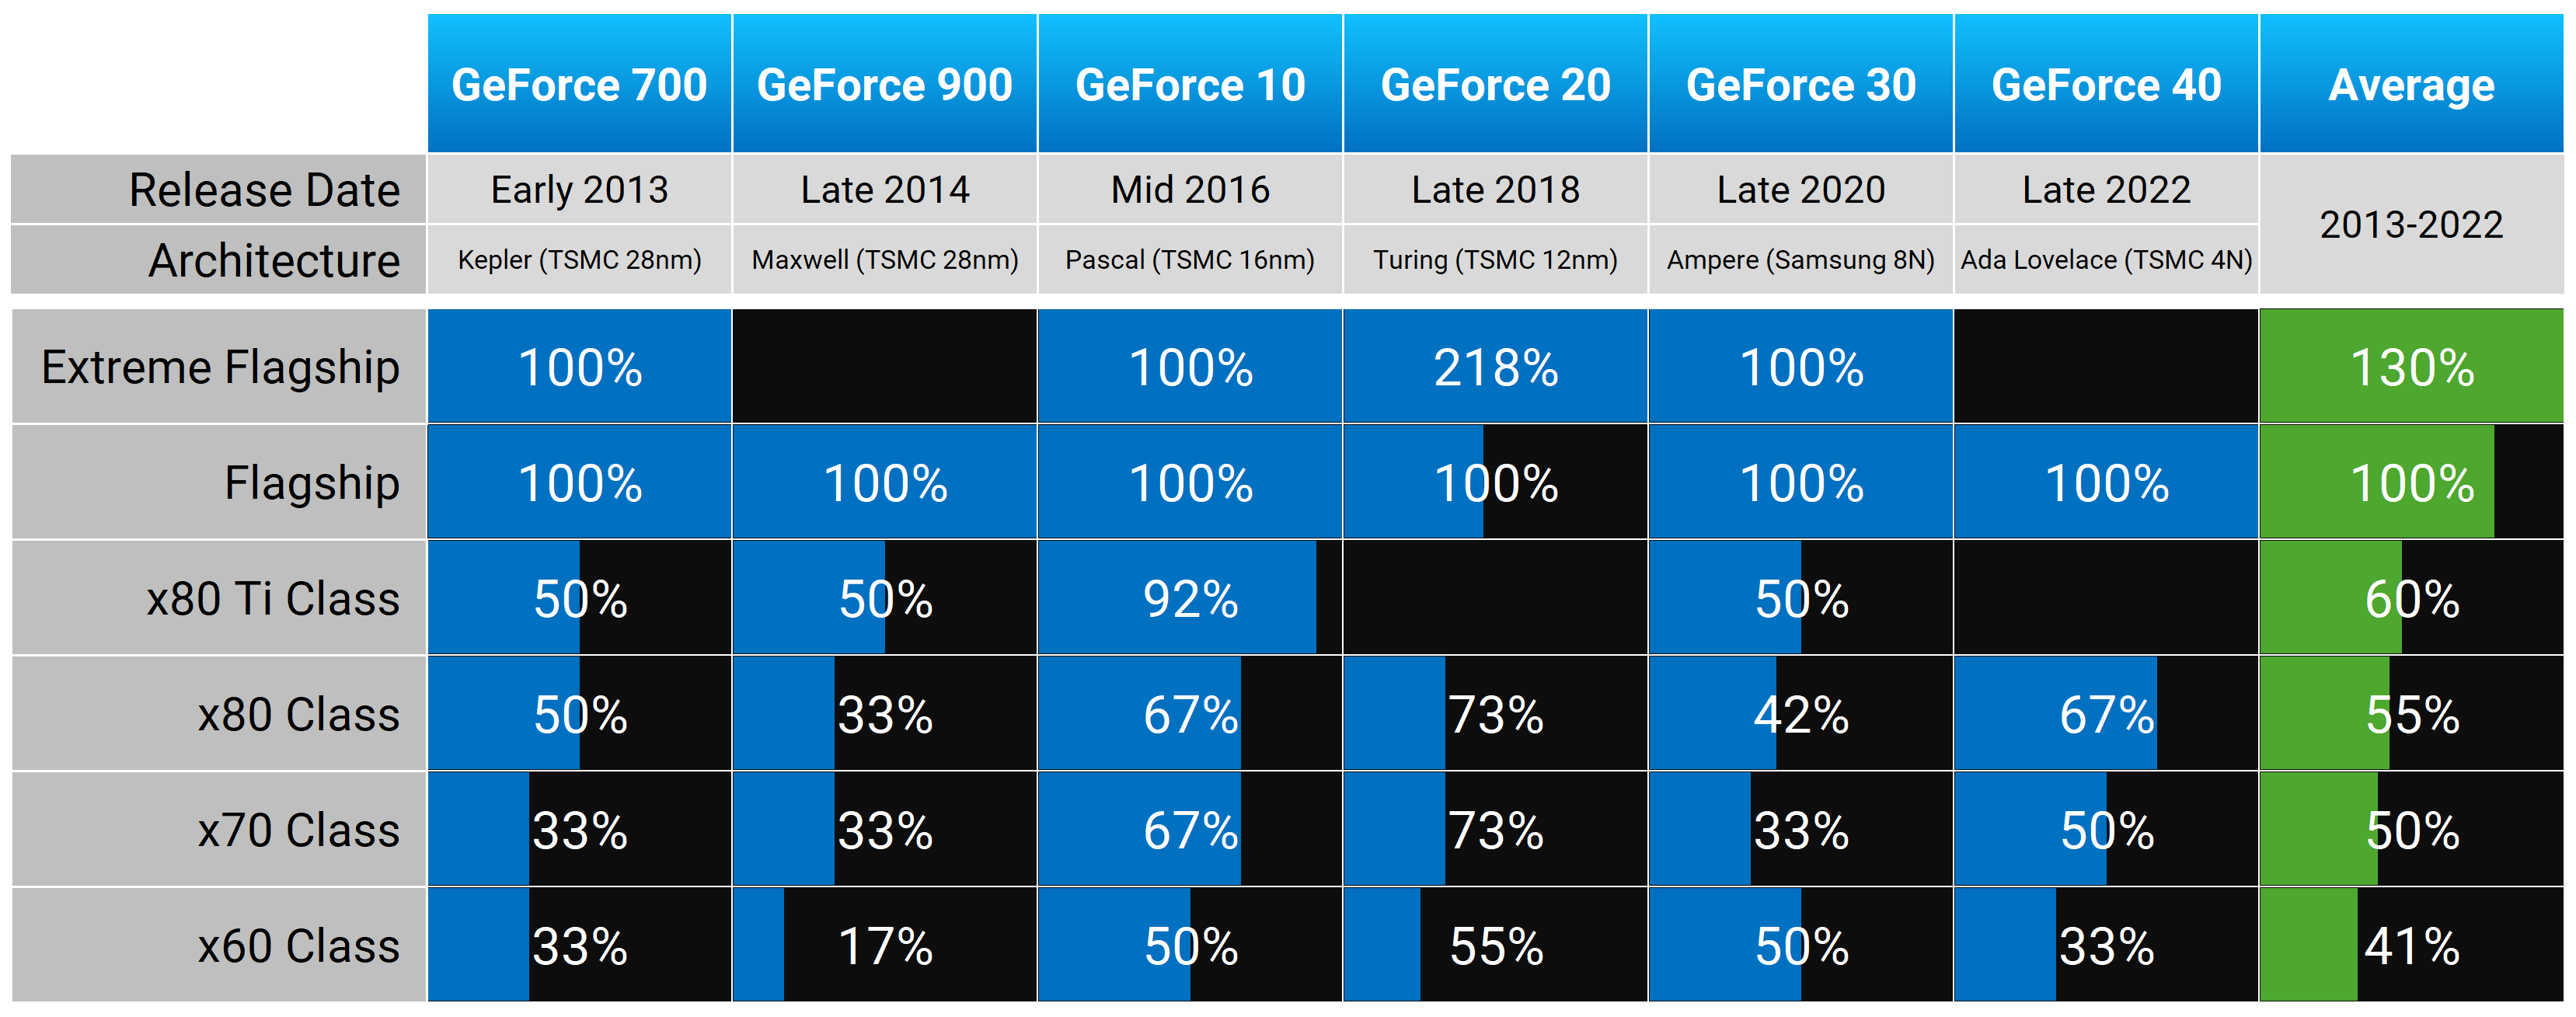
VRAM capacities are a bit all over the place depending on the generation, but on average, the 80 tier has given us 55% the VRAM of the flagship model, the 70 tier has halved the VRAM, and the 60 tier has given us 41% the amount of VRAM.
Some generations are much better than others, though. The GTX 10 series was a huge win for consumers with the flagship cards getting 12GB, the 80 and 70 class both getting 8GB, and the 60 class getting 6GB.
But in the generation prior, we had the GTX Titan X offering 12GB, the 780 Ti offering 6GB, but this was cut down to just 2GB on the GTX 960. In this area, the RTX 40 series is actually around the mark of an average GPU generation in terms of relative spacing of VRAM configurations.
Pricing
Another very important factor is price. Each tier has generally gotten more expensive over the years. In the GeForce 700 to 10 series days, you were typically looking at around $1,000 for the flagship card. These days, it’s up to $1,600.
The 80 class has gone from around $600 to ~$1,200, which is painful, thanks entirely to the 40 series. The 70 class was a little under $400 a decade ago, now it’s up to $500 or even $600. And the price for the 60 class card has increased as well.
Nvidia GPUs: Launch MSRP
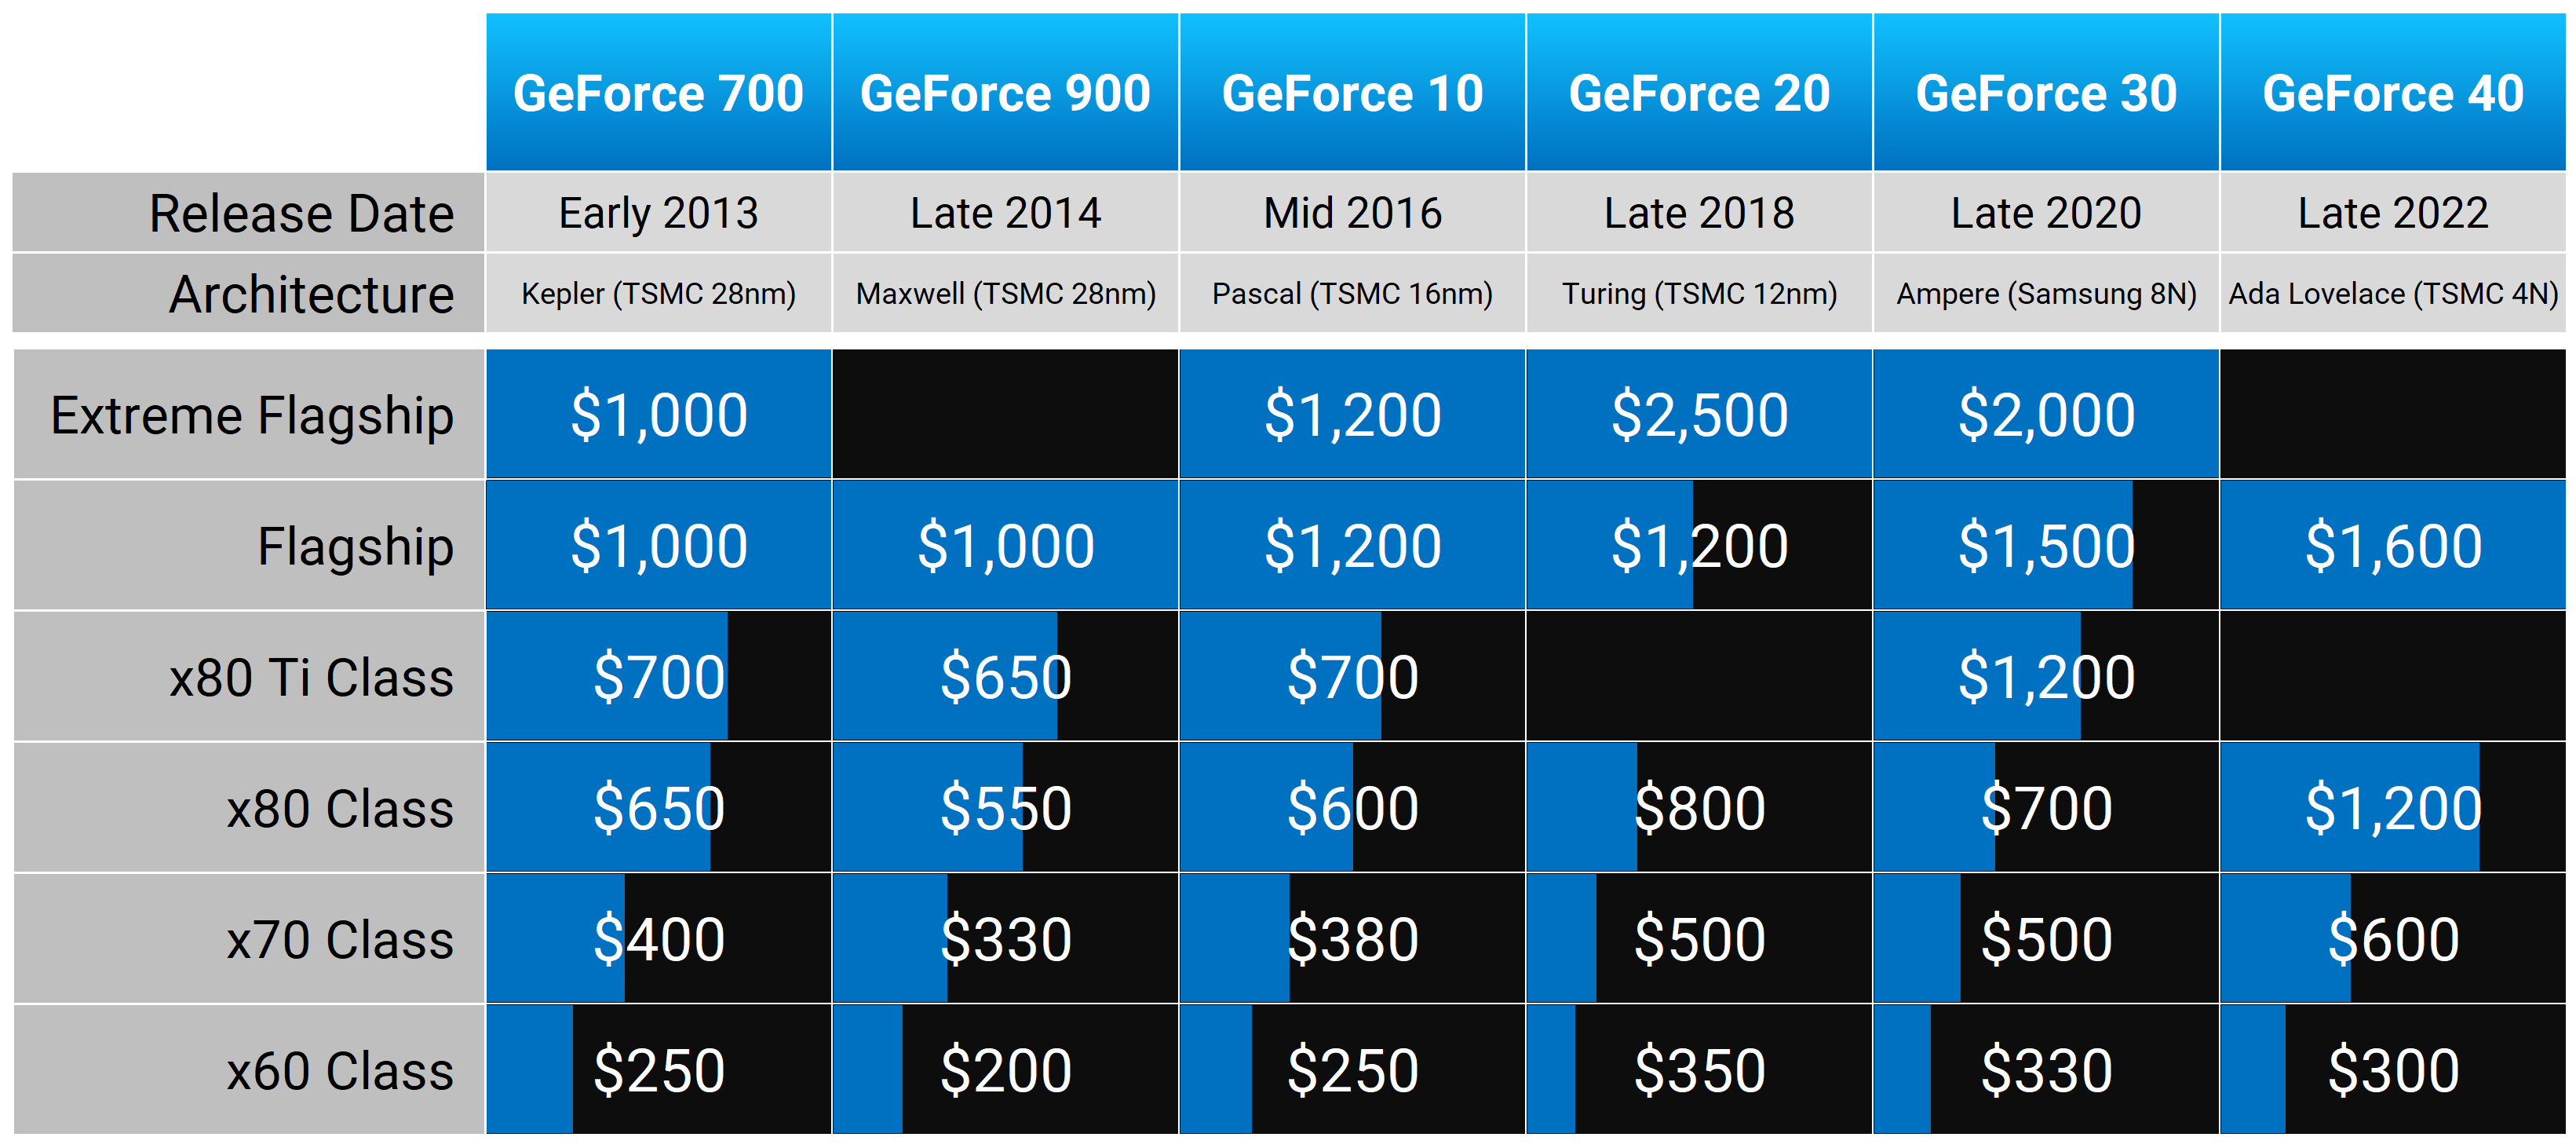
With that said, the $400 price of the GTX 770 back in 2013 would be more like $540 in today’s money, and the 700 GTX 780 Ti would be nearly $950 today. The RTX 4060 is actually slightly cheaper than it should be after inflation relative to the GTX 760. But on the whole, Nvidia GPU prices have indeed outpaced inflation in each tier.
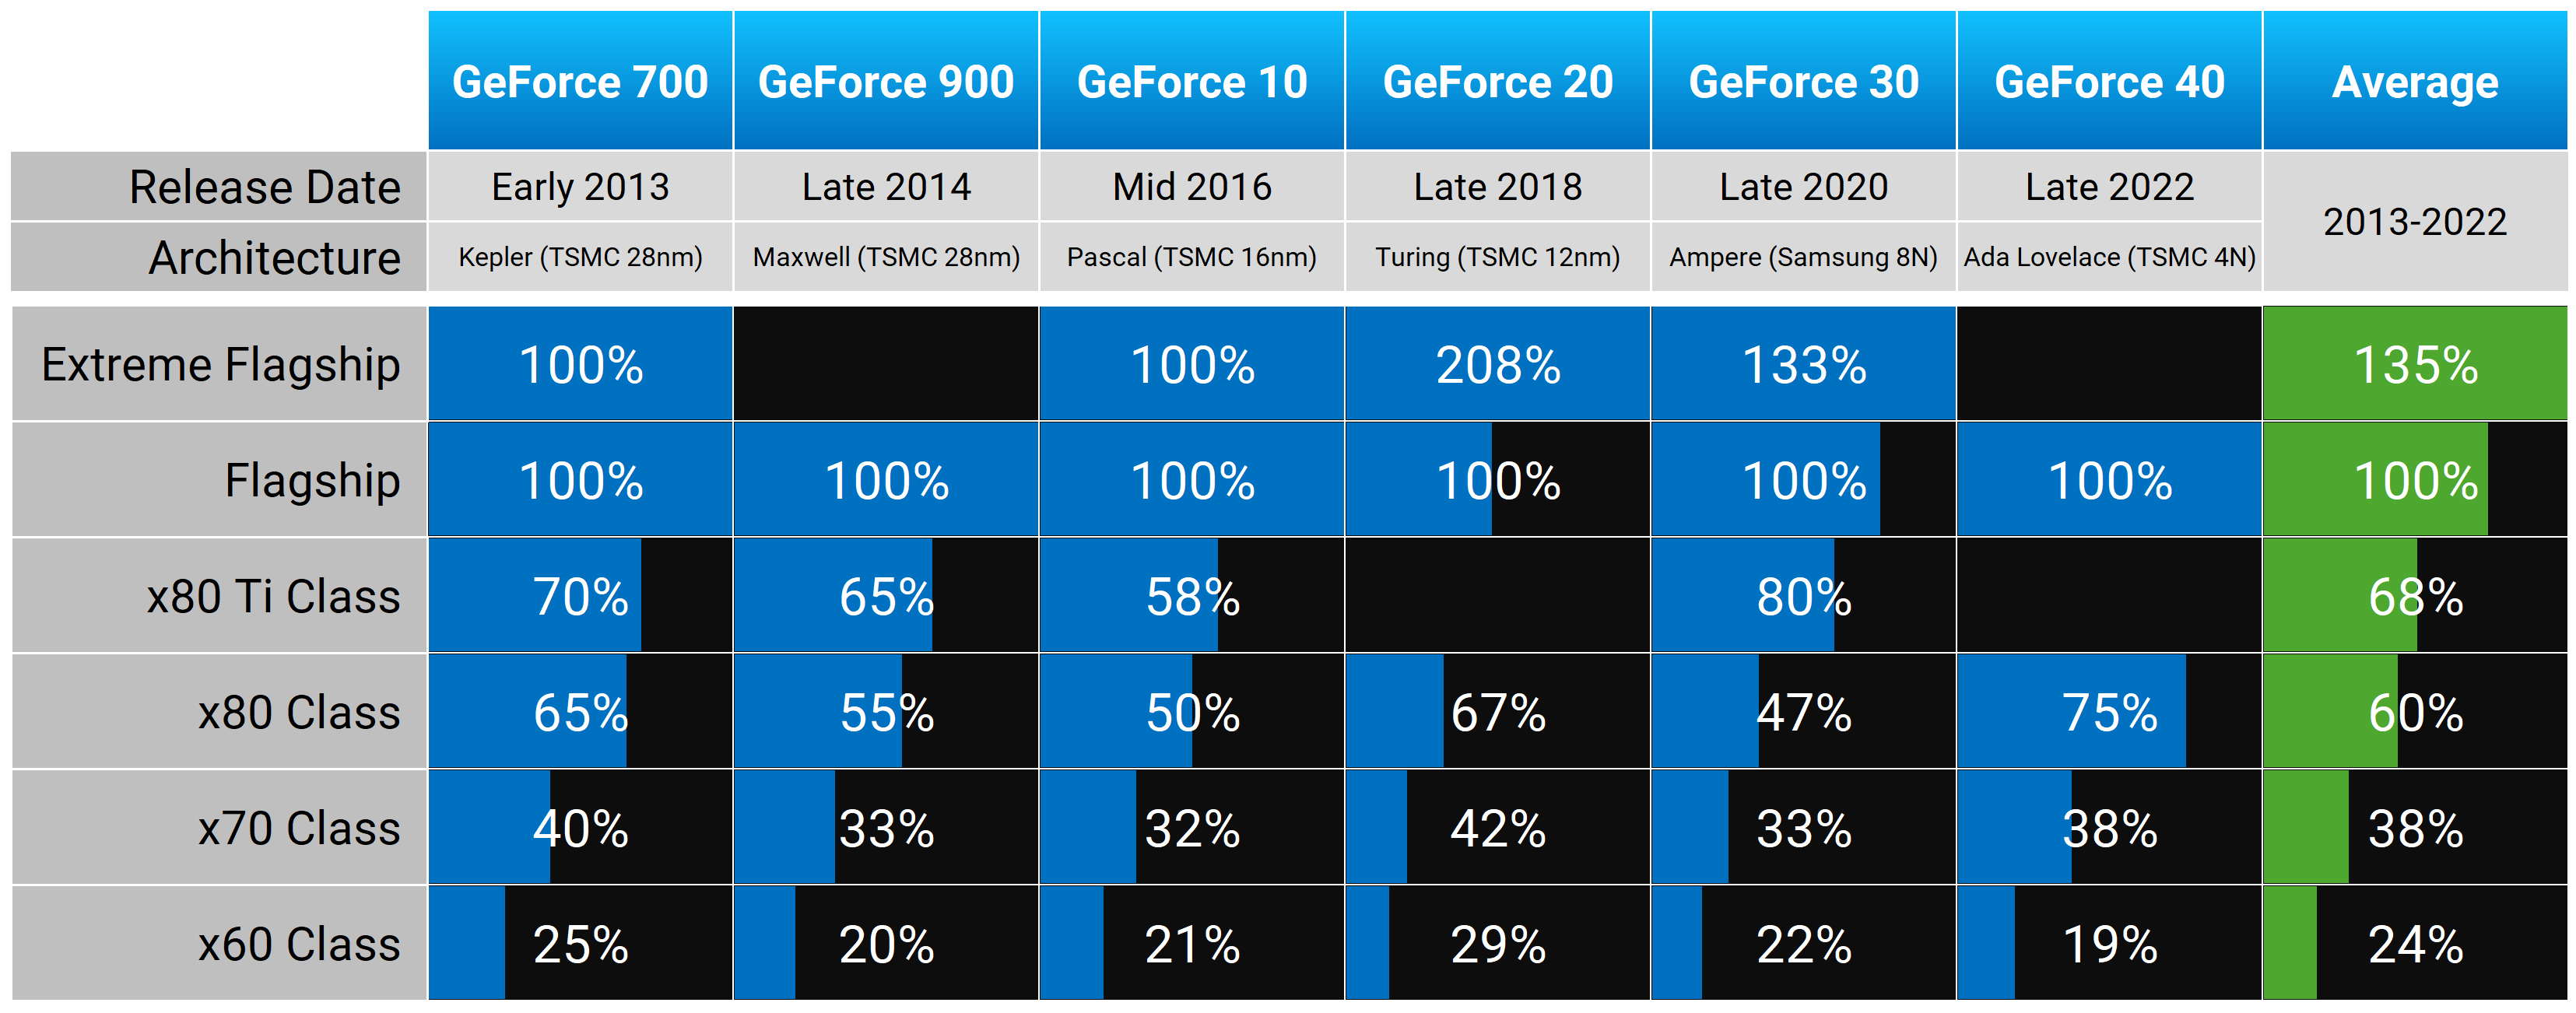
What hasn’t changed as much is relative pricing. On average, the 80 tier card is just 60% the cost of the flagship model, the 70 tier card is 38% the cost of the flagship, and the 60 tier card is just one-quarter of the price.
There are small abnormalities here and there – the RTX 2080 and RTX 4080 were both overpriced, the GTX 1070 a little cheaper than usual – but generally Nvidia sticks to this model.
The main driving factor of GPU prices has been that top-tier flagship model getting more expensive each year, which has driven up the rest of the lineup. A decade ago, the GTX Titan was $1,000, and the GTX 770 came in at 40% of that price, slotting in at $400.
In this current generation, the RTX 4070 launched at 38% the price of the flagship model… it’s just that the RTX 4090 was $1,600 and that meant the 4070 arrived at $600.
In a lot of instances, what makes this pricing structure work well is the inclusion of that better value 80 Ti class card. When cards like the GTX Titan, GTX Titan X, and RTX 3090 are ridiculous, the GTX 780 Ti, GTX 1080 Ti, and RTX 3080 Ti offer a better deal, usually slotting in at just 60 to 80% of the price of the flagship for only small reductions in configuration.
The two most recent generations that had worse than typical relative pricing – the 20 series and 40 series – both lacked a typical 80 Ti class card. The 40 series had no 4080 Ti, and in the 20 series, the 2080 Ti was effectively the flagship, leaving the RTX 2080 to creep up in price and fill the gap the 80 Ti class usually fills relative to the flagship.
What a Typical Nvidia GPU Generation Looks Like
When we average out the configurations of the last six generations, this is what a typical Nvidia GPU generation looks like. Relative to the generation’s flagship, the 80 series card delivers on average 72% of the shader cores, 77% of the memory bandwidth, and 55% of the VRAM capacity for 60% of the flagship card’s price.
The 70 series card delivers on average 54% of the cores, 61% of the bandwidth, and 50% of the VRAM capacity for 38% of the price. And the 60 series has on average 36% of the cores, 45% of the bandwidth, and 41% of the VRAM capacity for 24% of the price.
Nvidia GPUs: Typical Generation (2013-2022)
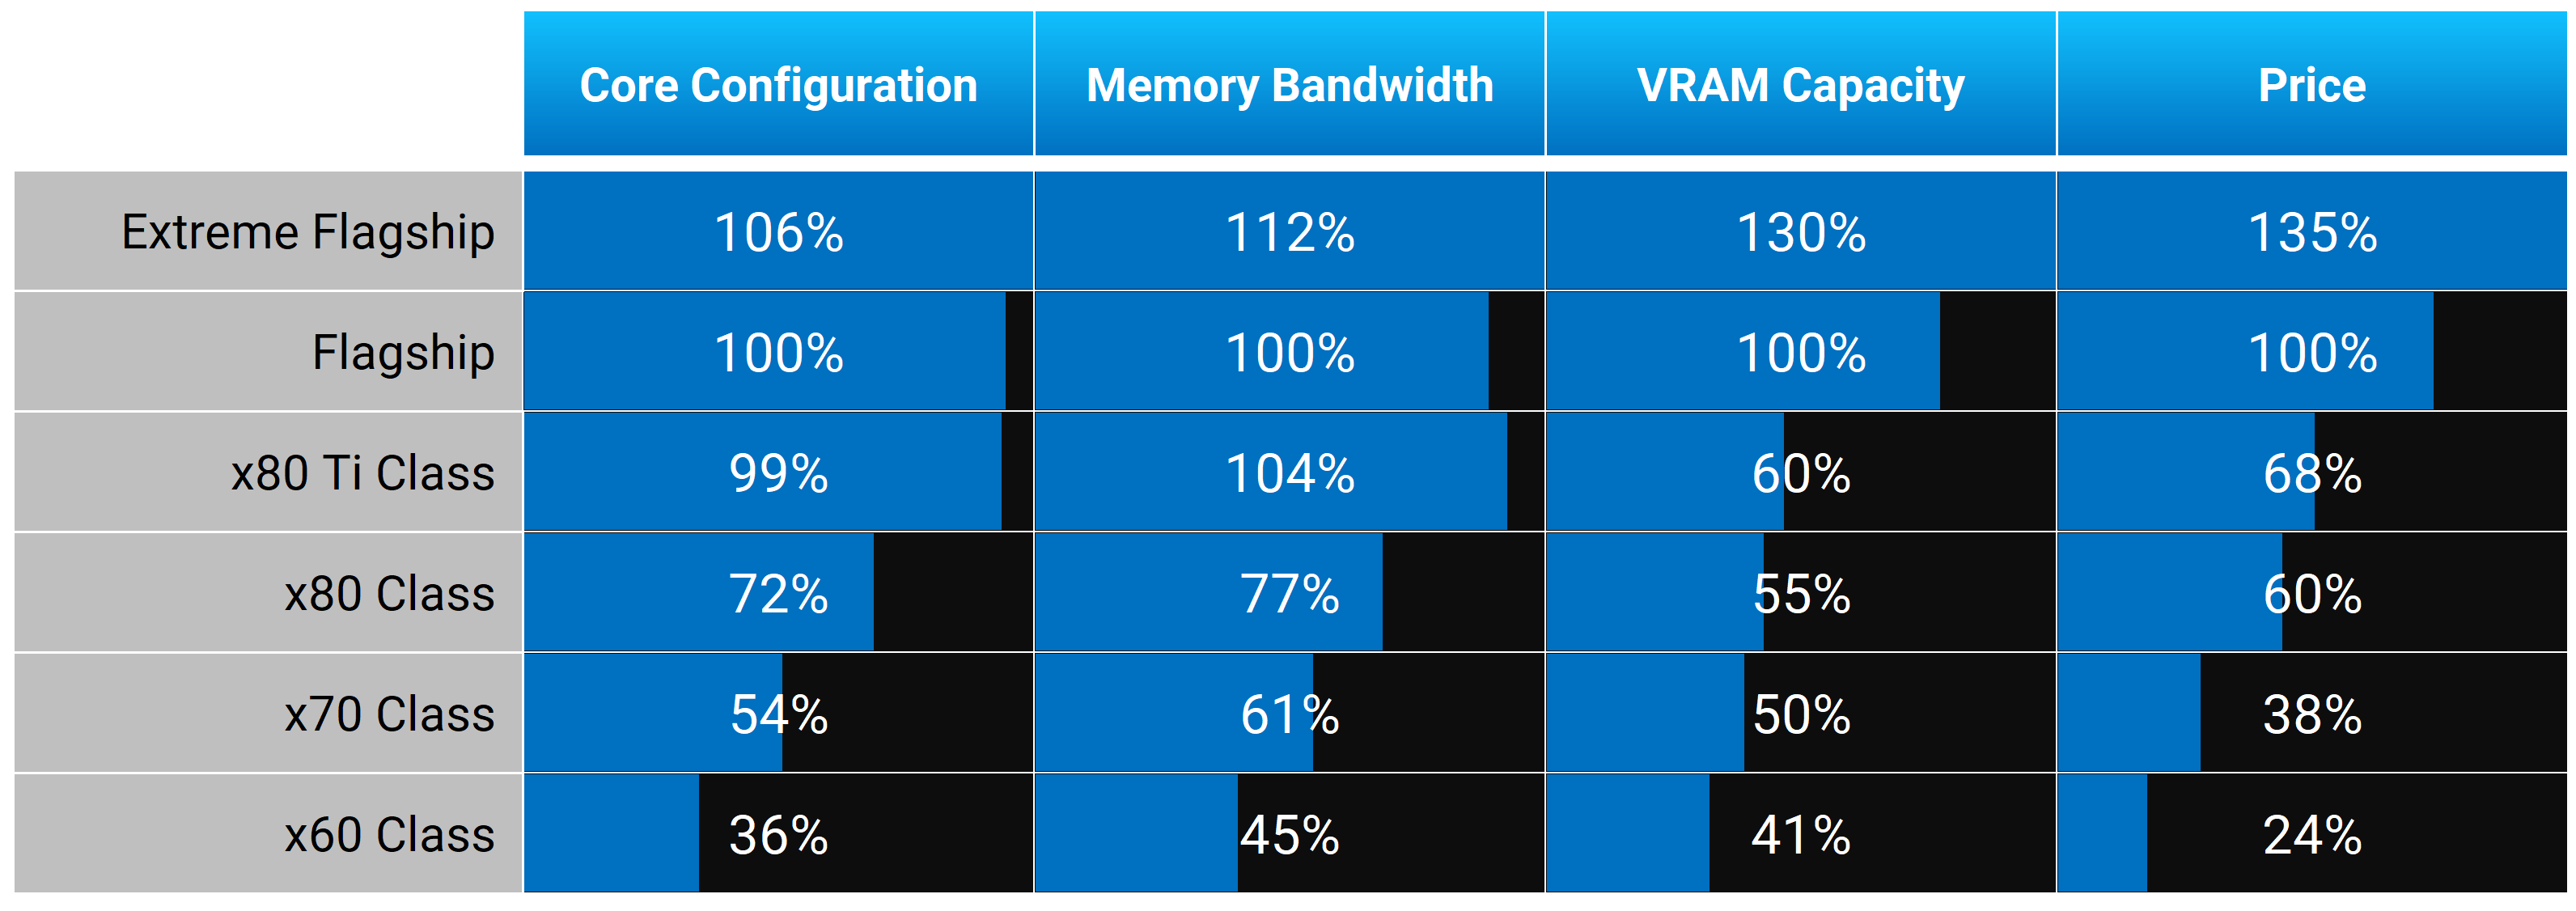
You can clearly see here how each jump down in the product stack sees a larger reduction to the price compared to its reduction in configuration. This preserves the value proposition of lower-tier models and means there’s historically been a price premium to get a faster card. It also means we can judge each generation based on this average.
The RTX 40 series was poorly received because each card was cut down more than it should have been, and in the case of the 4080, was both cut down more and priced higher than usual.
The RTX 30 series was a great success outside of crypto mining issues, with each model offering lower relative pricing at each of its usual configurations. The RTX 20 series had a typical set of configurations but higher relative pricing, making it underwhelming.
Then further back, the legendary GTX 10 series was bang on average in terms of core configurations, offered again at favorable relative pricing for lower-tier models. The 900 series was similar, though not quite as strong as the 10 series, and the 700 series wasn’t as cut down as usual across the lineup, but this came with average or slightly worse than average relative pricing.
How Do RTX 5080 and RTX 5090 Leaked Specs Stack Up?
So where do these rumors of the GeForce RTX 5090 and RTX 5080 fit in? Well, things aren’t looking good based on these rumored specifications. Known leaker kopite is suggesting the 5090 has 21,760 shader cores and 32GB of GDDR7 on a 512-bit bus. However, the RTX 5080 has 10,752 shader cores and 16GB of GDDR7 on a 256-bit bus.
This information suggests that the RTX 5080 has both the core and memory configuration cut in half relative to the flagship card, though we don’t know what memory bandwidth to expect as no GDDR7 speed was listed.
Based on our historic data looking back at six generations of Nvidia GPUs, the 70 tier is typically the class of card that is half the configuration of the flagship. Again, on average, we found that tier to have 54% of the core count, 61% of the memory bandwidth, and 50% of the VRAM size at 38% of the price.
Based on recent rumored RTX 5080 specifications, this looks to us to be more of an “RTX 5070” type of product. We’re not even trying to suggest that the rumor is wrong and that configuration is actually a 5070, just that if that configuration is labeled as a 5080, it would be the most cut-down 80 tier model in Nvidia’s history.
But more important than the name is the price. The benchmark is really set with the price: over the last six generations, when Nvidia offers you a card that’s half the flagship’s configuration, they’ve sold that for 62% less than the flagship.
This means that if the RTX 5090 is priced at $1,600, to be around the mark of previous generations, the RTX 5080 as configured should be a $600 GPU. If the 5090 is $2,000, the 5080 should be in the $750 to $800 range.
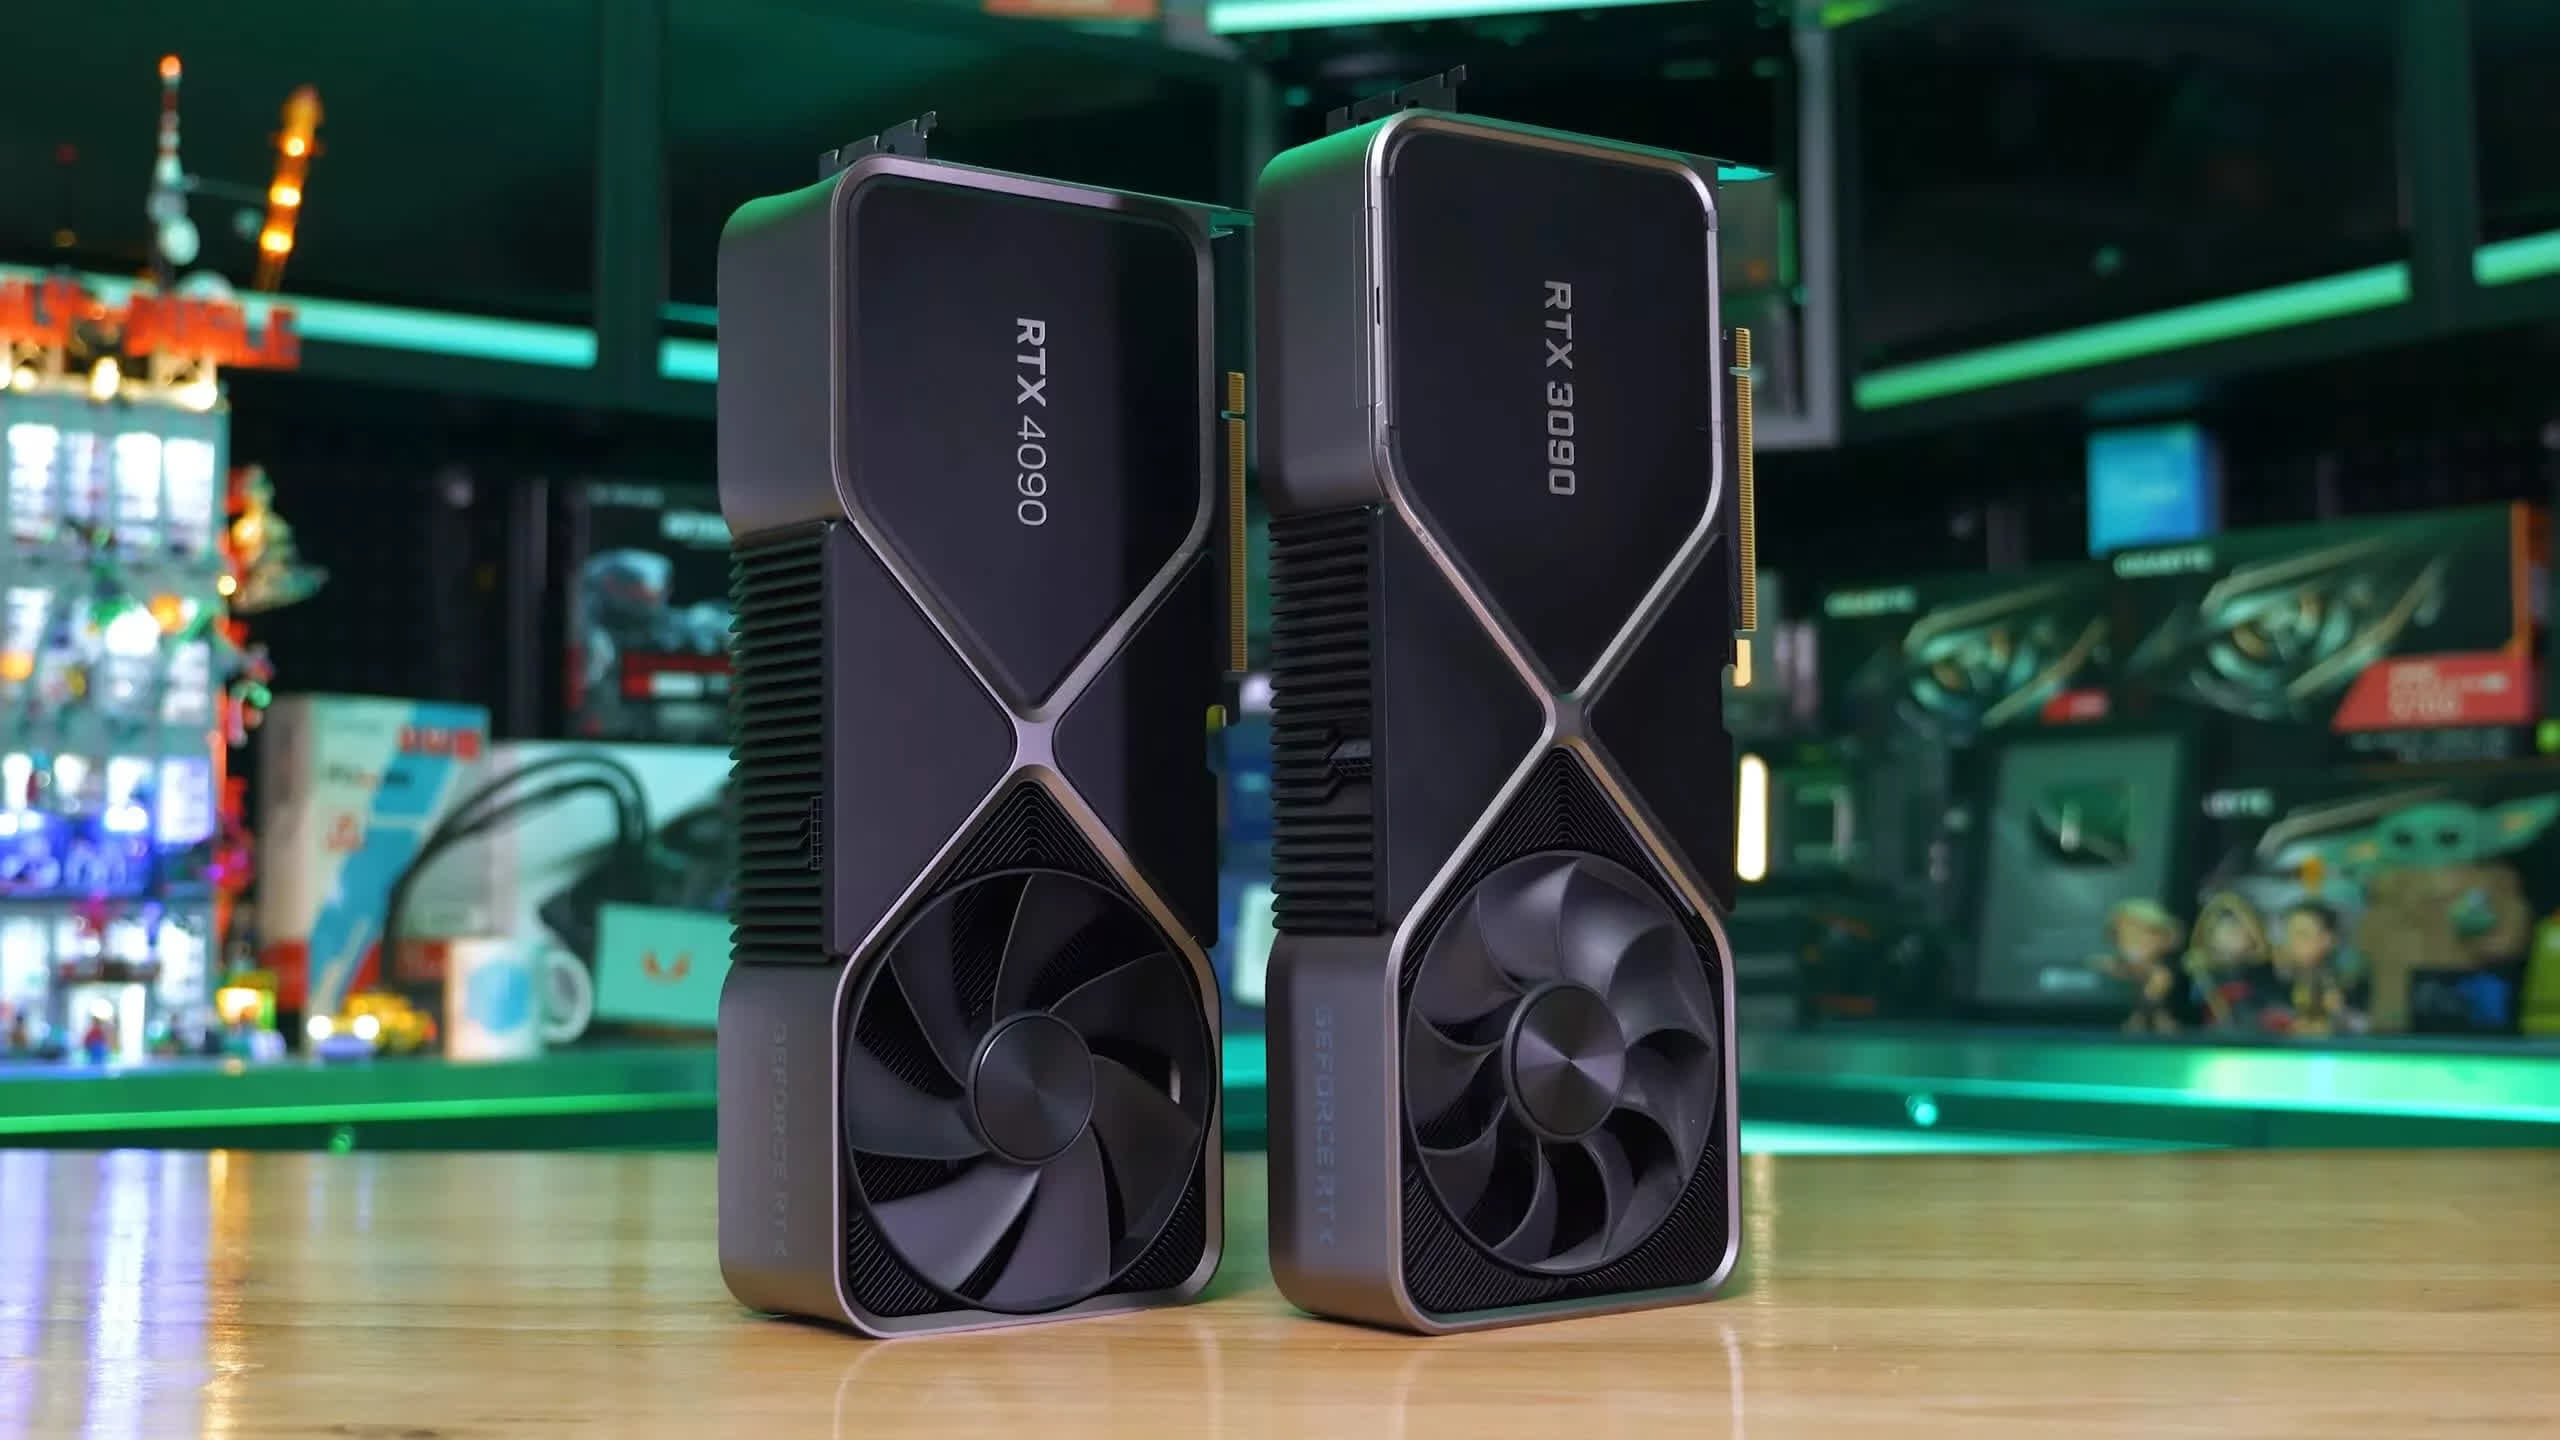
This analysis has focused on relative configurations and relative pricing, which is just one way to look at a graphics card generation. Price-to-performance ratios are equally, if not more, important, so a certain GPU configuration that’s weak relative to the best model may actually still be good overall depending on how its price-to-performance ratio stacks up compared to previous generation models.
But a big GPU configuration reduction will only succeed if either the flagship model is so powerful that a big cutback would still be very powerful, or if Nvidia is willing to reduce the price of a given product tier.
If the RTX 5080 is actually more like a 5070 in configuration and generational performance – but is also priced like a 5070 – it doesn’t really matter what it’s called. But if it’s a 5070 configuration priced and named like a 5080… well, now we’re in trouble.
Our ultimate goal here was to arm you with historic configuration and pricing information, so as we get closer to Nvidia’s official release of the RTX 50 series you’ll be better equipped to analyze the new models. With a clearer understanding of previous GPU lineups, you’ll be able to determine whether the new generation is reasonable or is ripping you off. It’s definitely something we’ll be keeping a close eye on.
Shopping Shortcuts:
- Nvidia GeForce RTX 4070 Super on Amazon
- AMD Radeon RX 7800 XT on Amazon
- Nvidia GeForce RTX 4070 Ti Super on Amazon
- AMD Radeon RX 7900 XT on Amazon
- Nvidia GeForce RTX 4080 Super on Amazon
- AMD Radeon RX 7900 XTX on Amazon
- Nvidia GeForce RTX 4090 on Amazon
